

Review Article | DOI: https://doi.org/10.31579/2834-8761/027
Predictive Modeling of Metabolomics data to Identify Potential Biomarkers in Renal Cell Carcinoma
1 Department of Pharmacoinformatic, National Institute of Pharmaceutical Education and Research (NIPER), Sector-67, S. A. S. Nagar (Mohali)
2 Center for Systems Biology and Bioinformatics, Panjab University, Sector 14, Chandigarh
3 Department of Medicinal Chemistry, National Institute of Pharmaceutical Education and Research (NIPER), Sector-67, S. A. S. Nagar (Mohali),
*Corresponding Author: Pooja Arora, 70022, Department of Pharmacoinformatics, National Institute of Pharmaceutical Education and Research (NIPER), Panjab University, Sector 14, Chandigarh - 160014, India.
Citation: Pooja Arora, Ambati Sekhar Reddy, Veena Puri, Prasad V. Bharatam, (2023), Predictive Modeling of Metabolomics data to Identify Potential Biomarkers in Renal Cell Carcinoma, Clinical Endocrinology and Metabolism, 2(4) DOI:10.31579/2834-8761/027
Copyright: © 2023, Pooja Arora. This is an open access article distributed under the Creative Commons Attribution License, which permits unrestricted use, distribution, and reproduction in any medium, provided the original work is properly cited.
Received: 27 July 2023 | Accepted: 14 August 2023 | Published: 17 August 2023
Keywords: renal cell carcinoma, biomarkers, metabolomics
Abstract
Renal cell carcinoma (RCC) is a rare human cancer whose prevalence is rapidly rising, an early recognition is essential for the effective disease treatment. A statistical approach for biomarkers identification using metabolomics data has been attempted in this work. The metabolomics data for RCC is extracted from metabolomics workbench database with study ID ST001706. The study consisted 50 metabolites and 256 patients; in that 174 are normal individuals and 82 are RCC patients. From 50 Metabolites, top metabolites (as biomarkers) are identified using advanced statistical techniques such as the t-test, principal component analysis (PCA) and partial least square analysis (PLS). These statistical results identified eight biomarkers i.e. Trigonelline, Hippuric acid, 4-hydroxyhippuric acid, 4-amino hippuric acid, Mannitol, Pyruvic acid, Scyllo-Insitol and Deoxycholic acid. The Gaussian software was used to obtain the 3D Structures of the metabolites and to calculate their electronic parameters. Relative quantification of these biomarkers was done using Heatmap. ROC Curve Analysis has been performed to characterize biomarkers early in RCC. The biological significance of identified top metabolites has been evaluated by identifying the metabolic pathways in which the metabolites are involved.
Introduction
Metabolomics is a relatively new approach of evaluating the composition of a biofluid (plasma or urine) or tissue in which small molecule metabolites are studied. This collection of small molecules, when analyzed and interpreted, can provide a distinct signature that can be used for diagnosis as well as to determine gross metabolic differences between a normal and a diseased state.1 Renal cell carcinoma (RCC) is another name for hypernephroma, renal cancer, or kidney cancer. It is the third most common urological oncology, accounting for 2-3% of all malignancies.2 RCC is a fast-growing cancer that frequently spreads to other organs such as the lungs.2 Among urogenital cancers, RCC has the highest mortality rate, and its prevalence has steadily increased. RCC is curable with surgery if detected in time, although a minority is at risk of recurrence.3 Symptoms of RCC are usually absent in the early stages. As the disease progresses, the patient may develop symptoms such as a lump on the back, hematuria, lower back pain, unexplained weight loss, fatigue, anemia, and hypertension. Some risk factors for the disease include a family history of RCC, dialysis treatment, hypertension, obesity and cigarette smoking. RCC is treated with surgery, radiation therapy, chemotherapy, immunotherapy, and targetedtherapy.4
In metabolomic studies data-driven technology provides numerous insights into metabolic modelling and tends to help with pharmaceutical research, nutrition, and toxicity.5 The metabolomics approach in addition to biomarker discovery can identify new druggable targets because understanding the metabolic disorder and altered biochemical pathways that occur with disease progression can provide insight into possible new treatments for that disease by identifying inhibitors of altered pathways among new and already existing drugs. As a result, metabolomics lends itself to a two-pronged approach to the clinical problem, addressing both disease symptoms and providing novel treatment methods.6
Biafran et al. (2021), reported Machine Learning-Enabled Renal Cell Carcinoma Status Prediction Using Multiplatform Urine-Based Metabolomics: The study cohort consisted of 105 RCC patients and 179 controls separated into two sub cohorts: the model cohort and the test cohort. The model cohort was used to choose discriminating features using univariate, wrapper, and embedded techniques.7
Allegan et.al. (2017), Preoperative fasting urine and serum samples were collected from patients with clinical renal masses and metabolomics and multivariate statistical analysis were performed using 1H NMR and GCMS (gas chromatography-massspectrometry). RCC had higher levels of glycolytic and tricarboxylic acid (TCA) cycle intermediates compared to benign masses.8
Zheng et al. (2016), used serum metabolome data from 104 participants, including healthy individuals and early-stage RCC patients, to train and validate the SOM model. For the early detection of RCC, a biomarker cluster of seven metabolites (alanine, creatine, choline, isoleucine, lactate, leucine, and valine) was identified. Using a biomarker cluster, the trained SOM model was able to classify 22 test subjects into the appropriate categories.9
Bowie Xi et al. (2014), published a chapter on statistical analysis and modelling of mass spectrometry-based metabolomics data, in which the multivariate statistical techniques were used in metabolomics studies, ranging from biomarker selection to model building and validation.10
Ska et al. (2012) conducted a classification study on diagnostic statistics double-check validation.11
Kim et al. (2011), found that quinolinone, 4-hydroxybenzoate, and gentisate are differentially expressed with a false discovery rate of 0.26, and these metabolites are implicated in common amino acid and oxidative metabolism pathways, which is consistent with high tumour protein breakdown and utilisation and the Warburg effect.12
Because targeted therapy for RCC has adverse effects, it is critical to identify potential targets for early diagnosis and treatment. Because metabolomics data is complex, there is a need for metabolomics research using statistical modelling to predict meaningful insights.
This research used statistical methods and metabolomics data to find potential biomarkers for the early detection of Renal Cell Carcinoma. The following sections provide more information.
Methodology:
Data collection
Olatomiwa, OB.; David, AG.; Machine Learning-Enabled Renal Cell Carcinoma Status Prediction Using Multiplatform Urine-Based Metabolomics, J. Proteome Res. 2021, 20, 7, 3629–3641 - Olatomiwa O. Biafran et.al., Collected Data from liquid chromatography–mass spectrometry (LC–MS) and nuclear magnetic resonance (NMR) and potential metabolomic panels for RCC were discovered using machine learning (ML). The study cohort consisted of 82 RCC patients and 174 controls. The data for this study is available in Metabolomics workbench database (https://www.metabolomicsworkbench.org/) with Study IDs: ST001705 and ST001706.6
Data analysis
Various statistical techniques like median normalization, t-test, PCA, PLS were used to analyze the data.
The Median Normalization is based on the assumption that the samples of a data set are separated by a constant. It scales the sample values on a common scale to have same median. By choosing the median instead of the mean, it helps to remove some of the outliers in the data.13
The t-test is used to evaluate if a method has an effect on both samples or if the groups are different from each other. An unpaired t-test compares the averages/means of two independent or unrelated groups to see whether there is a statistically significant difference between them.14
Principal Component Analysis is a dimensionality reduction method for extracting important variables (in the form of Principal components) from a large number of variables in a data set.15
Instead of using the original data, partial least squares (PLS) reduce the data to a smaller set of uncorrelated components and performs least squares regression on these components. It solves the multicollinearity problem by constructing latent vectors that explain both the independent and dependent variables. When more than one dependent variable needs to be predicted, this method is utilized.16
The dataset obtained had a wider range of values initially the data was preprocessed using median normalization. The significant metabolites were then identified by applying unpaired t-test on the Normalized Data. Top metabolites were selected as those with a significance value (P value) of less than 0.05 and were employed in further analysis. Following the t test; the top significant metabolites were further analyzed using the PCA method. The principal components were identified, and top 20 metabolites are extracted based on Variable Importance Number using statistica Software, which were then validated and considered as RCC biomarkers. Following PCA, the top metabolites from the t test were validated using the PLS method.
The top metabolites reported after PCA and PLS were compared to the literature, and the common metabolites found in all three were considered as potential biomarkers, which were subsequently studied to learn more about their toxic effects in Renal Cell Carcinoma.
Quantum chemical studies were performed on Identified Biomarkers to Study their Toxicity using Gaussian 09 Software. All the geometry optimizations were carried out using Density Functional Theory (DFT) employing 6-31+ G(d) basis set and the B3LYP functional.17 Then the global electrophilicity index () of identified biomarkers was calculated , which measures the energy of stabilization when an optimal electronic charge transfer from the environment to the system occurs. In order to prove the toxicity, Toxtree Tool18 was used and Biological Significance of Biomarkers associated with Renal Cell Carcinoma was studied by identifying the molecular pathways in which metabolites are involved.
Results and Discussion:
1. Identifying biomarkers using Predictive Statistical modelling:
1.1 Data preprocessing by Median Normalization:
The data preprocessing was done by imputing the missing values and Median Normalization. The missing values were identified and they were replaced with median values. The Median Normalization was carried out for each metabolite. Those Normalized Values were used in further Analysis to identify Biomarkers.
1.2. T- test:
For the Normalized dataset unpaired t test was carried out using Statistical Analysis Module of Emotionalist Tool19 (https://www.metaboanalyst.ca/). The metabolites having the p-value less than 0.05 are considered as the significant metabolites which have a significant effect on Renal Cell Carcinoma. Based on the p-value 33 metabolites are identified significant metabolites and those were taken for further processing (Table1)
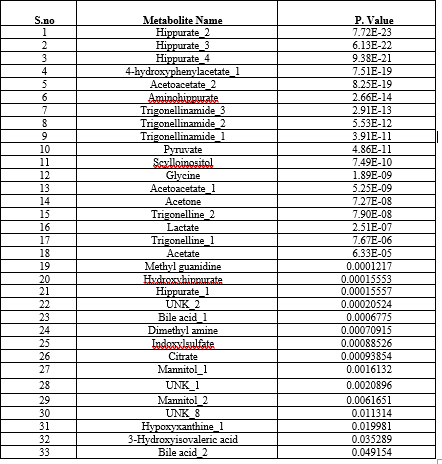
Table 1: t-test results Showing 33 Significant Metabolites
1.3. Principal Component Analysis (PCA)
The principal component analysis was performed using statistical package statistica 13.3 27 (TIBCO Software Inc) on top 33 metabolites obtained after t-test. The results of PCA in Statistica gave the significance values of metabolites in the power column which implies the probability of metabolite responsible for causing the disease and based on the value of power the ranking is given in the variable importance column (Table 2). The top 20 ranking metabolites were considered for further analysi
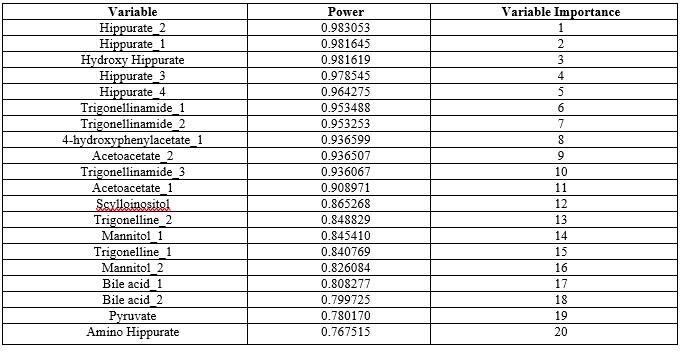
Table 2: PCA Results Showing Top 20 Metabolites
1.4. PLS Results
PLS analysis was performed to validate the results from PCA. The PLS was also Performed by statistical software and the variable importance of each metabolite in the dataset is given in VIP column which implies the significant values of metabolites. The ranking was provided according to the VIP column (Table 3). The metabolites with top 20 ranks were selected as significant metabolites for identification of biomarkers.
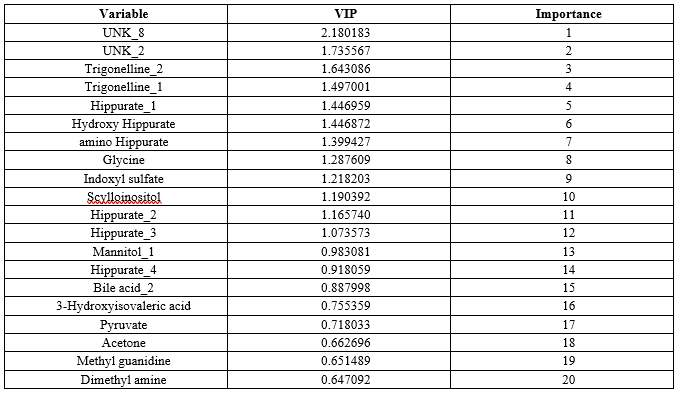
Table 3: PLS Results Showing Top 20 Metabolites
The top metabolites obtained after both PCA and PLS were compared with the literature and the metabolites present in all three i.e. PCA, PLS and literature were considered as the potential biomarkers. They were 8 metabolites which were common those are Trigonelline, Hippuric acid, 4-hydroxy hippuric acid, 4-amino hippuric acid, Mannitol, Pyruvic acid, Scylla- Inositol and Deoxycholic acid and these were further explored to know their toxic effects in Renal Cell Carcinoma.
2. Electronic structure analysis of identified biomarkers
Quantum Chemical Calculations was performed using Gaussian 09 Software on 8 Biomarkers. All the Geometry Optimizations were carried out using Density Functional Theory (DFT) employing 6-31+G (d,p) basis set and the B3LYP Functional to get their HOMO and LUMO values which were further used for calculating global electrophilicity index (Table 4).
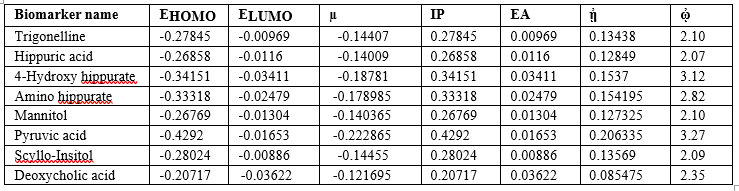
Table 4: Global Electrophilicity index values of Biomarkers
The electrophilicity Index values of these biomarkers are High (>2), which denotes that these all are toxic metabolites and highly Responsible for the Disease. Hence the electrophilicity is responsible for the observed RCC.
3. Toxfree Tool
Based on the decision tree approach by applying Cramer rule to the SMILES notation of Biomarkers, Toxfree software gives the Class of Toxicity. The software makes the decision based on the information available in the literature and classify the metabolites as High toxic, Intermediate Toxic and Low toxic. 18 The toxicity of top 8 metabolites according to Toxfree software is shown in Table 5
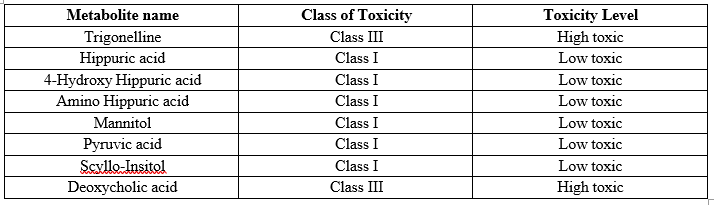
Table 5: Toxicity of top metabolites according to Toxfree software
4. Relative Quantification of metabolites by Heatmap
Heatmap is used to identify features that are unusually high/low using stronger intensities of one color to represent lower levels of the variable, and increasing intensities of a different color to represent higher levels.19 Heat Map of Renal Cell Carcinoma Biomarkers was constructed using Emotionalist 5.0 Tool (Figure 1) up regulated and down regulated metabolites can be seen clearly in the Table 6
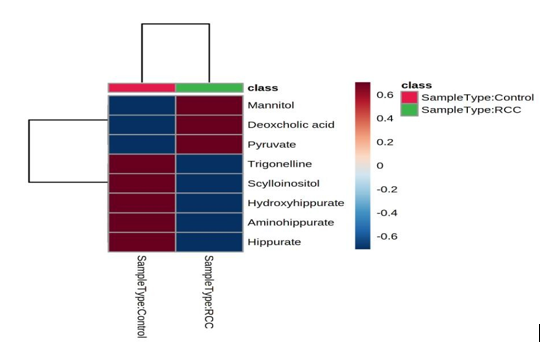
Figure 1: Heat Map of RCC Biomarkers
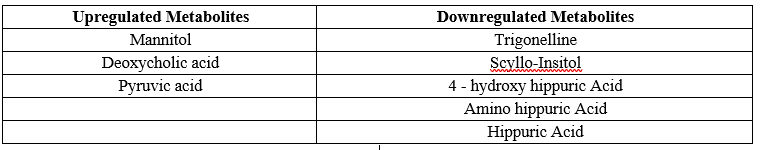
Table 6: Up regulated and down regulated metabolites
The concentration of up regulated Metabolites like Mannitol, Deoxycholic Acid and Pyruvic acid is increased in RCC patients when compared to Normal Healthy Individuals. Similarly for Down Regulated Metabolites like Trigonelline, Scyllo-Insitol, 4 - hydroxy hippuric acid, amino hippuric acid and hippuric acid, the concentration decreased in RCC patients when compared to Normal Healthy Individuals. From these variations in the concentrations of the metabolites in diseased patients in comparison to normal healthy individuals, it can be concluded that a set of metabolites are down regulated, while another set were unregulated significantly in diseased individuals which can help in prognosis of the Renal cell carcinoma These results were consistent with the existing literature.
5. ROC Curve Analysis
A receiver operating characteristic (ROC) analysis was performed using Emotionalist 5.0 on these 8 biomarkers to assess their diagnostic accuracy and characterize them in early stage of RCC.20 The AUC, sensitivity, specificity, and 95 % confidence intervals of the eight identified Potential urinary biomarkers for RCC early diagnosis are shown in Table 7. To evaluate the diagnostic accuracy of these identified potential urinary biomarkers for RCC, a predictive model for patient classification was constructed using each identified biomarker. Pyruvic acid and Deoxycholic acid showed a AUC Value of 0.854 (Figure 2) and 0.807 (Figure 3) respectively and regarded as best biomarkers having high predictive accuracy and better distinguish the Control and RCC group when compared to other 6 biomarkers. Overall, 8 metabolites showed clinical potential diagnostic value, with an AUC of 0.923 (Figure 4) and an 81 % Predictive Accuracy (Figure 5). It has been observed that combination of biomarkers is more helpful than single biomarkers for early diagnosis of the disease.
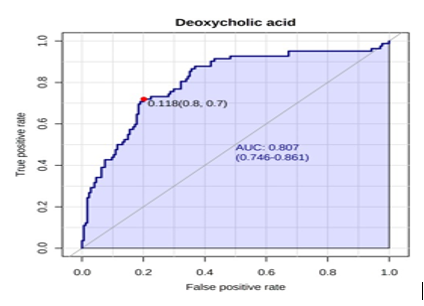
Figure 2: AUC – ROC Curve of Pyruvic acid
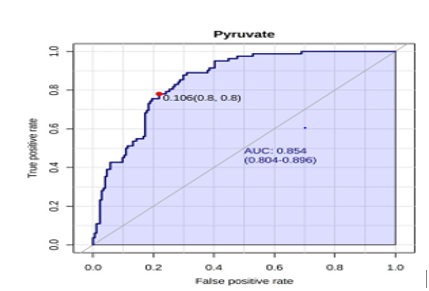
Figure 3: AUC – ROC Curve of Deoxycholic acid
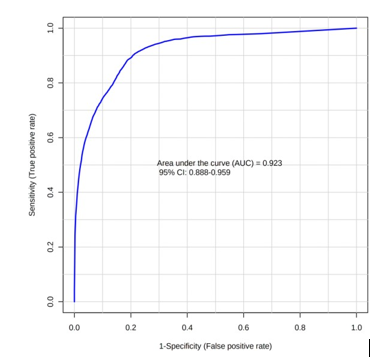
Figure 4: AUC – ROC Curve of All Metabolite Panel
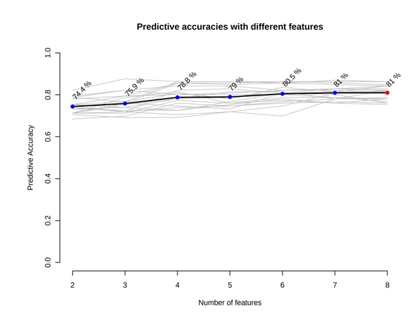
Figure 5: Predictive Accuracy with All Metabolite Panel
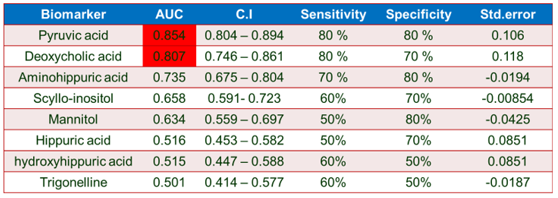
Table 7: ROC Curve Analysis
6. The metabolic pathways in which identified metabolites are involved
6.1. Trigonelline:
Márcia S. Monteiro et al (2016) in ‘‘Nuclear Magnetic Resonance metabolomics reveals an excretory metabolic signature of renal cell carcinoma’’ Reported that Trigonelline could be related to certain foods (e.g. coffee), but it can also be produced by endogenous niacin methylation. Reduced excretion of Trigonelline was found to be reported in patients with liver cancer, ovarian cancer, pancreatic ductal adenocarcinoma, and lung cancer. This change, together with the decreasing tendency of trigonelline shows that nicotinate and nicotinamide metabolism is disturbed. Putative interpretation of the identified metabolites changing in RCC compared to controls revealed possible unspecific effects involving Hippurate, trigonelline, and trigonelline, emphasizing the importance of diet and gut microflora, as well as nicotinate and nicotinamide metabolism and anti-oxidative mechanisms as less specific systemic cancer effects.20 The Nicotinate and Nicotinamide Pathway in which Trigonelline metabolite is collected from KEGG Pathway Database
6.2 Pyrvuic acid:
Márcia S. Monteiro et al (2016) in ‘‘Nuclear Magnetic Resonance metabolomics reveals an excretory metabolic signature of renal cell carcinoma’’ Reported that the increased levels of excreted pyruvic acid imply enhanced glycolysis activity. Increased glycolytic flux and altered TCA cycle function are well-known cancer hallmarks, affecting not only cellular energetic efficiency but also anabolic/biosynthetic efficiency, because intermediates in these pathways are diverted to the synthesis of proteins, nucleic acids, lipids, and cholesterol, and generally aid in the maintenance of cellular redox, genetic, and epigenetic status required for cancer cell proliferation.20 The Glycolysis Pathway in which pyruvic acid metabolite is collected from KEGG Pathway Database
6.3. Deoxycholic acid:
Márcia S. Monteiro et al (2016) in ‘‘Nuclear Magnetic Resonance metabolomics reveals an excretory metabolic signature of renal cell carcinoma’’ Reported that the presence of higher levels of Deoxycholic acid (Bile Acid) in both blood and urine of hepatocellular carcinoma patients as bile acid resonances implies that RCC has an influence on endogenous cholesterol metabolism. Bile acids are considered to be a significant indication of Liver injury. However, however at point, the exact connection between these compounds and RCC is unclear.20 The Secondary Bile Acid Biosynthesis Pathway in which Deoxycholic acid metabolite is collected from KEGG Pathway Database
6.4. Scyllo-Insitol / Myo-inositol:
Piotr Popławski et.al, (2017) in ‘‘Integrated transcriptomic and metabolomic analysis shows that disturbances in metabolism of tumor cells contribute to poor survival of RCC patients’’ reported that in RCC tumors Myo-inositol level was reduced by 16-fold and was associated with decreased MIOX. However, given the lower myo-inositol levels in RCC tumours, a decrease in MIOX expression may appear counter-intuitive. Decreased myo- inositol level in RCC tumours may be the result from increased excretion in urine. This study suggested that Myo-inositol and Myo-inositol pathway may offer attractive targets for potential treatment of RCC patients.21 The Inositol Phosphate Pathway in which Myo-inositol metabolite is collected from KEGG Pathway Database
6.5. Mannitol:
Leuthold et al. (2017) conducted a comprehensive metabolomic and lipidomic profiling of human and porcine kidney tissue study using a LC-QTOF-MS analytical approach. PCA analysis showed differentiation in aqueous extracted metabolites from RCC compared to adjacent nontumor tissue. The metabolite level of metabolite Mannitol is increased in the RCC tissue. This Study concluded that Disruption in fructose and mannose metabolism pathway of Mannitol is responsible for RCC.22 The Fructose and Mannose metabolism pathway in which Mannitol metabolite is collected from KEGG Pathway Database
6.6. Hippuric acid, 4-hydroxyhippuric acid and 4-aminohippuric acid:
Daniela Rodrigues et.al, (2017) Márcia, Monteiro.; Carmen, Jerónimo.; Rui, Henrique.; Luís, Belo.; Maria de Lourdes Bastos, Paula Guedes de Pinho, Márcia, Carvalho.; Renal cell carcinoma: a critical analysis of metabolomic biomarkers emerging from current model systems,Translational Research,2017,180,1-11 Hippuric acid, 4-hydroxyhippuric acid and 4-aminohippuric acid, phenylalanine downstream metabolites showed potential as RCC biomarkers. It was found diminished in urine of RCC patients, suggesting that cancer cells rapidly metabolize it, which might cause impaired secretion into renal tubules. Hippuric acid was also found decreased in other renal diseases, emphasizing its poor specificity as an individual biomarker for RCC detection.23 The Phenylalanine Pathway in which Hippuric acid, 4-hydroxyhippuric acid and 4-aminohippuric acid metabolites is collected from KEGG Pathway Database
The above-mentioned metabolic pathways have been associated with Renal Cell Carcinoma in the literature, indicating that alterations in these pathways can cause Renal Cell Carcinoma.
Conclusion
Renal cell carcinoma (RCC) is a heterogeneous disease that is usually asymptomatic until late stage. There is an urgent need for RCC specific biomarkers identification that may be exploited clinically for diagnostic and prognostic purposes. In this study, metabolomic data was statistically explored for the identification of biomarkers in Renal Cell Carcinoma.
The raw dataset obtained from Metabolomics Society was preprocessed using Emotionalist 5.0 , a web based interface used for Metabolomics Data Analysis , and further statistical methods such as t-tests, PCAs, and PLS were applied using Statistical Software to identify Significant Metabolites. The top ranking eight metabolites obtained after both PCA and PLS were compared with the literature and the common metabolites present in all the three were considered as the potential biomarkers. Trigonelline, Hippuric acid, 4-hydroxy hippuric acid, 4-amino hippuric acid, Mannitol, Pyruvic acid, Scyllo-Insitol and Deoxycholic acid are considered as the Biomarkers of Renal Cell Carcinoma. These metabolites were further explored to understand their effect on the body. The quantum chemical studies were performed using Gaussian Software to evaluate their Electronic Parameters and Toxicity. A Toxicity Prediction tool called Toxfree was used to classify the biomarkers on the basis of toxicity, which showed 2 metabolites i.e. Trigonelline, Deoxycholic acid in the high toxic class (Class III) and 6 metabolites i.e. Hippuric acid, 4-hydroxy hippuric acid, 4-amino hippuric acid, Mannitol, Pyruvic acid and Scyllo-Insitol in Low Toxic Class (Class I). Relative Quantification using Heatmap showed that Mannitol, Deoxycholic Acid and Pyruvic acid are upregulated metabolites and Trigonelline, Scyllo-Insitol, 4 - hydroxy hippuric acid, 4- amino hippuric acid and hippuric acid are downregulated metabolites. From ROC curve analysis it has been observed that combination of biomarkers is more helpful than single biomarkers for early diagnosis of the disease. The toxic metabolites were further explored for their metabolic pathways and their association with Renal Cell Carcinoma using the literature. It can be predicted that the disturbance in the identified metabolic pathways due to these eight metabolites may be the cause of observed Renal Cell Carcinoma.
Abbreviations
RCC Renal Cell Carcinoma
MIOX Myo-Inositol Oxygenase
SMILES Simplified Molecular Input Line Entry System
HOMO Highest Occupied Molecular Orbital
LUMO Lowest Unoccupied Molecular Orbital
AUROC Area Under Receiver Operating Characteristics
LC–MS Liquid Chromatography–Mass Spectrometry
AUC Area Under Curve
ROC Receiver Operator Characteristic
PCA Principal Component Analysis
PLS Partial Least Square
DFT Density Functional Theory
Funding
Thanks to Department of Biotechnology, Ministry of Science and Technology, Government of India under DBT project number - BT/PR40164/BTIS/137/17/2021.
References
- Hsieh, J, Purdue, M, Signoretti, S, (2016). Renal cell carcinoma. Nat Rev Dis Primers. 2017 ,3, 17009
View at Publisher | View at Google Scholar - Jun, G.; Manuel, C M.; Nazli, D.; Ameish, G.; Sumanta, K. P.; Metastasis in renal cell carcinoma: Biology and implications for therapy.Asian Journal of Urology. 3 ,286-292.
View at Publisher | View at Google Scholar - Brian, I Rini.; Steven., C Campbell, Bernard, Escudero.; (2009). Renal cell carcinoma, The Lancet.,373,1119-1132
View at Publisher | View at Google Scholar - Johnson, C.H., Ivanisevic, J. and Siuzdak, G., (2016). Metabolomics: beyond biomarkers and towards mechanisms. Nature reviews Molecular cell biology. 17, 451-459.
View at Publisher | View at Google Scholar - Jeffrey R. Idle, Frank J. (2007). Gonzalez, Metabolomics, Cell Metabolism,6.
View at Publisher | View at Google Scholar - Mamas, M.; Dunn, W. B.; Neryses, L.; Goodacre, R. (2011). The role of metabolites and metabolomics in clinically applicable biomarkers of disease. Arch. Toxicon., 85, 5-17.
View at Publisher | View at Google Scholar - Olatomiwa O. Biafran.; David A. Gaul.; Samyukta Sah, Rebecca S. Arnold, et all., (2021). ; Machine Learning-Enabled Renal Cell Carcinoma Status Prediction Using Multiplatform Urine-Based Metabolomics. J. Proteome Res. 20, 3629–3641.
View at Publisher | View at Google Scholar - Falegan, O.S.; Ball, M.W.; Shaykhutdinov, R.A.; Pieroraio, et all., (2017). M.E. Urine and Serum Metabolomics Analyses May Distinguish between Stages of Renal Cell Carcinoma. Metabolites, 7, 6.
View at Publisher | View at Google Scholar - Zheng H, Ji J, Zhao L, Chen M, Shi A, et all., (2016). Prediction and diagnosis of renal cell carcinoma using nuclear magnetic resonance-based serum metabolomics and self-organizing maps. Oncotarget. 7, 59189-59198.
View at Publisher | View at Google Scholar - Xi B,; Gu H,; Baniasadi H,; Raftery D,; (2014). Statistical Analysis and Modeling of Mass Spectrometry-Based Metabolomics Data. In: Raftery D. (eds) Mass Spectrometry in Metabolomics. Methods Mol. Bio., 1198.
View at Publisher | View at Google Scholar - Szymańska, E,; Saccenti, E,; Smilde, A.K,; (2012). Double-check: validation of diagnostic statistics for PLS-DA models in metabolomics studies. Metabolomics, 8, 3– 16.
View at Publisher | View at Google Scholar - Kyoungmi Kim, Sandra L. Taylor, Sheila Ganti, Lining Guo,; et all., (2011). Urine Metabolomic Analysis Identifies Potential Biomarkers and Pathogenic Pathways in Kidney Cancer. OMICS: J. Integr. Biol. 293-303.
View at Publisher | View at Google Scholar - Alysha M. De Livera.; Daniel A. Dias.; David De Souza.; Thusitha Rupasinghe.; James Pyke.; et all., (2012). Normalizing and Integrating Metabolomics Data. Anal. Chem.84, 10768-10776.
View at Publisher | View at Google Scholar - Pierre Baldi; Anthony D. Long, (2001). A Bayesian framework for the analysis of microarray expression data: regularized t -test and statistical inferences of gene changes. Bioinformatics, 17, 509–519.
View at Publisher | View at Google Scholar - Bartel, J; Krumsiek, J, Theis, F.J., (2013). Statistical methods for the analysis of high- throughput metabolomics data. Comput. Struct. Biotechnology. J, 4.
View at Publisher | View at Google Scholar - Szymańska, E; Saccenti, E, Smilde, A.K,; Westerhuis, J.A,; (2012). Double-check: validation of diagnostic statistics for PLS-DA models in metabolomics studies. Metabolomics, 8 ,3-16.
View at Publisher | View at Google Scholar - Parr, R. G.; Szentpály, L. v.; Liu, S. (1999). Electrophilicity Index. J. Am. Chem. Soc. 121, 1922–1924.
View at Publisher | View at Google Scholar - Patlewicz, G,; Jeliazkova, N,; Safford, R.J,; Worth, A.P,; Aleksiev, B,; (2008). An evaluation of the implementation of the Cramer classification scheme in the Toxtree software. SAR QSAR Environ. Res, 19, 495-524.
View at Publisher | View at Google Scholar - Jianguo, Xia; Nick, Psychogios.; Nelson, Young.; David, S. Wishart.; (2009). MetaboAnalyst: a web server for metabolomic data analysis and interpretation. Nucleic Acids Research, 37, 652–660
View at Publisher | View at Google Scholar - Soreide, K.; Receiver-operating characteristic curve analysis in diagnostic, prognostic and predictive biomarker research. J. Clin. Pathol., , 62, 1-5
View at Publisher | View at Google Scholar - Monteiro, M.; Barros, A.; Pinto, J,; Carvalho M.; Ana S. Et all., (2016). Nuclear Magnetic Resonance metabolomics reveals an excretory metabolic signature of renal cell carcinoma. Sci Rep, 6, 37275.
View at Publisher | View at Google Scholar - Piotr, Popławski.; Takayuki, Tohge.; Joanna, Bogusławska.; Beata, Rybicka.; Zbigniew, Tański.; et all., (2017). Integrated transcriptomic and metabolomic analysis shows that disturbances in metabolism of tumor cells contribute to poor survival of RCC patients. Biochimica et Biophysica Acta - Molecular Basis of Disease, 3,744-752
View at Publisher | View at Google Scholar - Leuthold P, Schaeffeler E, Winter S, Büttner F, Hofmann U, et all., (2017). Comprehensive metabolomic and lipidomic profiling of human kidney tissue: a platform comparison. J.Proteome Res 16, 933-944.
View at Publisher | View at Google Scholar - Daniela,Rodrigues.; Márcia, Monteiro.; Carmen, Jerónimo.; Rui, Henrique.; Luís, Beloet all., (2017,).a critical analysis of metabolomic biomarkers emerging from current model systems, Translational Research, 180,1-11
View at Publisher | View at Google Scholar
