

Research Article | DOI: https://doi.org/10.31579/2834-8761/001
Concept for Automatic Multi-object Organ Detection and Segmentation in Abdominal CT Data
*Corresponding Author: Andre Mastmeyer, Digital Health Management, Hochschule Aalen, Germany.
Citation: Nico Zettler and Andre Mastmeyer, (2022), Concept for Automatic Multi-object Organ Detection and Segmentation in Abdominal CT Data, Clinical Endocrinology and Metabolism, 1(1); DOI: 10.31579/2834-8761/001
Copyright: © 2022, Andre Mastmeyer, this is an open access article distributed under the Creative Commons Attribution License, which permits unrestricted use, distribution, and reproduction in any medium, provided the original work is properly cited.
Received: 05 August 2022 | Accepted: 15 September 2022 | Published: 20 October 2022
Keywords: 3D patient models; abdominal organs; liver; kidneys; spleen; pancreas
Abstract
The ability to generate 3D patient models in a fast and reliable way, is of great importance, e.g. for the simulation of liver punctures in a virtual reality simulation. The aim is to automatically detect and segment abdominal structures in CT scans. In particular among the selected organ group, the pancreas poses a challenge. We use a combination of random regression forests and U-Nets to detect bounding boxes and generate segmentation masks for five abdominal organs (liver, kidneys, spleen, and pancreas). Proof of concept training and testing was carried out on 50 CT scans from various public sources. Preliminary results showed Dice coefficients of up to 0.71. The proposed method can theoretically be used for any anatomical structure, as long as sufficient training data is available.
Introduction
Introduction
Virtual reality (VR) based simulation of interventions for training and planning is slowly gaining importance in clinical teaching and routine. VR methods can be used for various tasks, ranging from training scenarios for the medical student and staff, to individual patient related sim- ulations of planned operations [Mastmeyer et al., 2016a], [Mastmeyer et al., 2016b], [Mastmeyer et al., 2017], [Mastmeyer et al., 2018]. The necessary individual patient models should be available fast and be accurate to guarantee a plausible simulation.
The first step in producing patient models is to acquire patient image data. This data will be used for the following steps in the modelling process. It is desirable to use high-quality image data, because inaccuracies will be carried over to the resulting model. The next step is the coarse localisation of the organs inside organ-specific volumes of interest (VOI) to simplify their subsequent segmentation.
The aim of our study, is to automatically detect bounding boxes for organs in abdominal CT data by a learning from example method. The detected bounding boxes are then used for segmentation. Detection of the abdominal organs can be a challenge, because of the variety of shapes these organs can have. The intensity based features of these organs are also challenging, because the intensity range of neighbouring organs often overlaps. We detected five abdominal organs (liver, right kidney, left kidney, pancreas, spleen), that are commonly used in simulations.
We used a random-forest method, that is developed by Criminisi et al. [Criminisi et al., 2013a] to automatically detect the bounding boxes of abdominal organs. The method uses random-regression-forests to predict the location of organ bounding boxes in CT data. Furthermore, we used the U-Net, proposed by Ronneberger et al. [Ronneberger et al., 2015], to automatically segment organs. The training and testing are carried out on a database of 50 abdominal CT scans, that had to be segmented beforehand.
Material and Methods
The database, that is used for training and testing, consists of 50 CT scans from three different sources: SLIVER071, LiTS2 and VISCERAL3. The data sets contain only abdominal CT data. The sets also vary in quality and field of view, to capture the variability of organs and scans. The scans are not only different in the number of slices (ranging from 64 to 861), thickness of slices (1-5 mm) and field- of-view, but also in image noise. This variability in the datasets is important, to ensure robustness vs. typical inference factors of clinical image data during training and application. All five target organs (liver, pancreas, left kidney, right kidney, spleen) are included in the scans.
Only a small fraction of the segmentation maps contained all five target organs, thus manual structure segmentation was necessary frequently.
1http://sliver07.org
2https://competitions.codalab.orgcompetitions/17094
3http://visceral.eu/closed-benchmarks/anatomy3
1.1 Definition of ground truth bounding boxes
The segmentation maps associated to the CT scans are the basis for the extraction of ground truth bounding boxes to be learned. A bounding box can be described as a cubical polyhedron that completely encloses an object.
The corresponding organ bounding boxes of each of the scans can be created by scanning the segmentation maps for coordinate direction extremes of label occurrence. To create a three-dimensional bounding box, for each coordinate direction (x, y, z), we iterate slice wise through the segmentation map and save the extreme limits with an object label.
1.2 Training of the models
Our concept is composed of two different machine learning approaches,
(1) bounds detection and (2) CNNs U-Nets for segmentation. E.g. here, the random regression forests (RRF) are used to detect organ bounding boxes in CT data, while other approached are ready for usage [Kern and Mastmeyer, 2022]. The U-Nets make use of the detected bounding boxes and segment the contained organs.
1.2.1 Training random regression forests for bounding box detection
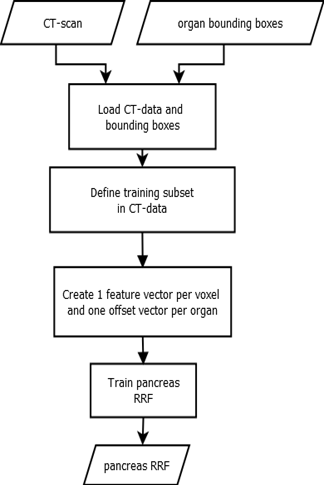
The decision trees used in RRFs split by minimising variance, then each leaf node outputs the mean of all label values in the node. We use RRFs to determine the location and extent of abdominal organs [Criminisi et al., 2013a]. The main difference between random classification forests and RRFs, is the type of output that is predicted. While classification forests try to categorize objects, regression forests predict continuous values. Regression forests partition the data into manageable chunks to predict average values. As seen in Fig. 1, the method expects CT scans and ground truth bounding boxes as input.
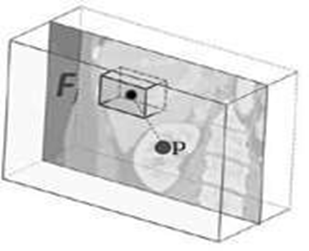
A three-dimensional bounding box bc of an organ c can be described by using a six-dimensional vector bc = (bLeft, bRight, bAnterior, bPosterior, bHead, bFoot) with co-ordinates in mm [Criminisi et al., 2013a]. We run over all voxels p = (xp, yp, zp), which are within a specified radial distance (r = 5 cm) from the scan medial axis. The distance d between such a voxel and each of the bounding box walls, can be calculated by using d(p) = (xP − xLeft, xP − xRight, yP − yAnterior, yP − yPosterior, zP − zHead, zP − zFoot) and is saved as the offset-vector to be learned. In contrast to Criminisi et al. [Criminisi et al., 2013a], we use only 50 feature boxes, that are evenly distributed on three spheres (r = 5 cm, 2.5 cm, 1.25 cm) to generate the input feature vector. The feature boxes Fj are intended to capture the spatial and intensity context of the current voxel. For this purpose, the mean intensities of the feature boxes are calculated and saved in the feature vector. An example feature box is shown in Fig. 2. While training, the RRF learns
1.2.2 Training of a U-Net for semantic segmentation
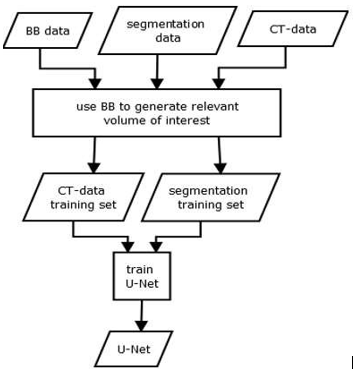
The training data for our U-Net consists of the expert segmentations and ground truth bounding boxes, as schematised in Fig. 3. The bounding boxes (VOIs) are then used to locally extract the intensity and label data from the CT scans and their corresponding label maps. As input, the U-Net receives a VOI from the intensity data, while the same region within the label data is connected to the output. We use the U-Net architecture proposed by Ronneberger et al. [Ronneberger et al., 2015], which consists of nine layers with four down- and up-scale steps. The network was trained using batches of size 15 over 50 epochs. In addition, Adam optimization and a cross entropy loss function were used. We trained one U-Net for each organ, using a ReLU activation function.
1.3 Application of the models
In the first step, the organ specific RRFs predict the organ bounding box candidates. Then, a distance vector is selected by majority voting and converted into a six-dimensional vector to describe the final organ-specific bounding box.
Now, the U-Net model gets the corresponding bounding box as input. Since the U-Net only accepts a static number of voxels, the BB is resized to a fixed size. The U-Net uses the data contained inside the given bounding box, to segment the corresponding organ. The output is a segmentation map of the full target organ.
1.4 Evaluation
We used a five-fold Monte Carlo cross-validation based on a 30:20 (train:test) data split. The target bounding boxes extend along the three-axis x, y, z. The resulting segmentations of the combined application are compared against the reference segmentations by using the Dice coefficient [Taha and Hanbury, 2015].
Results
Table 1 shows the Dice coefficients achieved by our conceptual method for all five target organs. We compared our values to studies, that tried to segment the same organs with automatic methods.
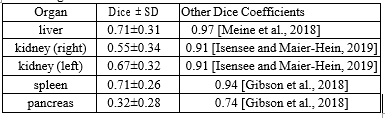
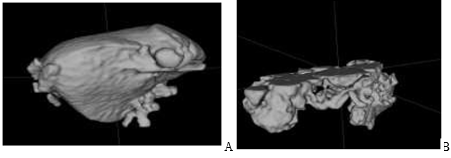
The best results show up for the liver and spleen. Both organs achieve a dice coefficient of 0.71. The right kidney is slightly worse vs. left with mean values of 0.55 and 0.67 respectively. The segmentation of the pancreas achieved the lowest dice coefficient with only 0.32. The standard deviation is similar for all organs ranging from 0.26 to 0.34. An example segmentation is presented in Figure. 4.
Segmentation of unseen patient image data scan takes between 30 seconds and one minute depending on the size of the data, i.e. on an Intel-i7 processor with a consumer NVIDIA GTX 1050 GPU.
Discussion
We were able to detect organ bounding boxes of variable qualitys automatically. Though, the overall position and extent of the predicted bounding boxes has to be improved to ensure a satisfying segmentation.
Especially the prediction along the z-axis is not accurate enough and resulted in boxes that are displaced. Due to misalignment, some segmentation masks are cut off, because parts of the organ are missing. The standard deviations were too high, indicating highly varying results.
In summary, the results of the current state of the segmentation method are affected by displaced bounding boxes and could not compete with the Dice coefficients of related studies. Especially the pancreas is a challenge.
Future works should focus on the accuracy and robustness of the bounding box detection [Kern and Mastmeyer, 2022]. The quality of the tar- get segmentation depends heavily on the quality of the detected bounding boxes. We used predicted bounding boxes, to produce results for a completely automatic method.
Acknowledgements
Funding from German Research Foundation: DFG-MA 6791/1-1.
References
- Criminisi, A., Robertson, D., Konukoglu, E., Shotton, J., Pathak, S., White, S., and Siddiqui, K. (2013). Regression forests for efficient
View at Publisher | View at Google Scholar - anatomy detection and localization in computed tomog- raphy scans. Medical Image Analysis, 17(8):1293-1303.
View at Publisher | View at Google Scholar - A, Robertson, D, Pauly, O., Glocker, B, Konukoglu, E, Shotton J., Ma- teus, D., Martinez Möller, A., Nekolla, S. G., and Navab, N. (2013). Anatomy Detection and Localization in 3D Medical Images, page 198. Springer London, London.
View at Publisher | View at Google Scholar - Gibson, E., Giganti, F., Hu, Y., Bon- mati, E., Bandula, S., Gurusamy, K., Davidson, B., Pereira, S. P., Clarkson, M. J., and Barratt, D. C. (2018). Automatic multi-organ segmentation on abdominal CT with dense V-Networks. IEEE Transactions on Medical Imaging, 37(8):1822-1834.
View at Publisher | View at Google Scholar - Isensee, F. and Maier- Hein, K. H. (2019). An attempt at beating the 3D U-Net.
View at Publisher | View at Google Scholar - Kern, D. and Mastmeyer, A. (2022). 3d bounding box detection in volumetric medical image data: A systematic literature review. Journal of Image and Graphics - JOIG.
View at Publisher | View at Google Scholar - Mastmeyer, A., Fortmeier, D., and Handels, H. (2016). Random forest classification of large volume structures for visuo-haptic rendering in CT images. page 97842H.
View at Publisher | View at Google Scholar - Mastmeyer, A., Wilms, M., Fortmeier, D., Schröder, J., and Handels, H. (2016). Real-time ultrasound simulation for training of US- guided needle insertion in breathing virtual patients. In Studies in health technology and informatics.
View at Publisher | View at Google Scholar - Mastmeyer, A., Wilms, M., and Handels, H. (2017). Interpatient respiratory motion model transfer for virtual reality simulations of liver punctures. Journal of World Society of Computer Graph- ics- WSCG. 25(1):1-10.
View at Publisher | View at Google Scholar - Mastmeyer, A., Wilms, M., and Handels, H. (2018). Population-based respiratory 4D motion atlas construction and its application for VR sim- ulations of liver punctures. In SPIE Medical Imaging 2018: Image Processing. International Society for Optics and Photonics.
View at Publisher | View at Google Scholar - Meine, H., Chlebus, G., Ghafoorian, M., Endo, I., and Schenk, A. (2018). Comparison of u-Net-based convolutional neural networks for liver seg- mentation in CT.
View at Publisher | View at Google Scholar - Ronneberger, O, Fischer, P, and Brox, T. (2015). U-Net: Convolutional networks for biomedical image segmentation. Med Image Comput Comput Assist Interv – MICCAI. page 234-241.
View at Publisher | View at Google Scholar - Taha, A. A. and Hanbury, A. (2015). Metrics for evaluating 3D medical image seg- mentation: analysis, selection, and tool. BMC med imag- ing, 15(1):29.
View at Publisher | View at Google Scholar
