

Research Article | DOI: https://doi.org/10.31579/2835-7957/155
Association Between Hyperglycemia and Brain Stroke
1Department of History, University of Burdwan, Burdwan, West Bengal, India.
2Department of Statistics, University of Burdwan, Burdwan, West Bengal, India.
3Dept. of Agricultural Statistics, Uttar Banga Krishi Vishwavidyalaya, Cooch Behar, W.B., India.
4Department of Statistics, Independent University, Bangladesh, Dhaka, Bangladesh.
*Corresponding Author: Rabindra Nath Das, Department of Statistics, University of Burdwan, Burdwan, West Bengal, India.
Citation: Mahashweta Das, Gaurab Bhattacharyya, Deb S. Gupta, Shipra Banik and Rabindra N. Das, (2026), Association Between Hyperglycemia and Brain Stroke, Clinical Reviews and Case Reports, 5(1); DOI:10.31579/2835-7957/155
Copyright: © 2026, Rabindra Nath Das. This is an open-access article distributed under the terms of the Creative Commons Attribution License, which permits unrestricted use, distribution, and reproduction in any medium, provided the original author and source are credited.
Received: 12 December 2025 | Accepted: 24 December 2025 | Published: 06 January 2026
Keywords: average blood glucose (glu); body mass index (bmi); brain stroke (str); hypertension (hyp); heart disease (hrt) status; joint generalized linear models (jglms)
Abstract
The article focuses on the role of average blood glucose level (GLU) on some brain stroke patients based on 750 real study subjects consisting of both normal and brain stroke patients. The current outcomes have been derived herein using joint statistical modeling. It is derived herein that mean GLU level is positively associated with the joint interaction effect (JIE) of age and stroke (STR) i.e., AGE*STR (P=0.0432), JIE of hypertension (HYP) and residence type (RES) i.e., HYP*RES (P=0.0261), while it is negatively associated with the JIE of smoking (SMO) status and HYP i.e., SMO*HYP (P=0.0206), ever married (MAR) and heart disease (HRT) status i.e., MAR*HRT (P<0.0001). In addition, variance of GLU level is positively associated with HYP (P<0.0001), HRT (P=0.0327), JIE of MAR and STR i.e., MAR*STR (P=0.0327), while it is negatively associated with the JIE of HYP and MAR i.e., HYP*MAR (P=0.0001). There are many more associations of GLU levels with many other factors for brain stroke patients in the both mean and variance models. It can be concluded that average GLU levels maintain very complicated roles with several heart disease risk factors, physical and lifestyle factors. The brain stroke treatment process may be benefitted using the present derived complicated associations of glucose levels with the other factors. For all common people, the report informs about the controlling of GLU levels, BMI and smoking at older ages.
1.Introduction
Hyperglycemia (or elevated average blood glucose levels) is one of the most common the early phases of comorbidities in ischemic stroke, which is associated with brain infarct growth, worsened neurological outcomes and hemorrhagic transformation [1-5]. Many clinical and experimental stroke research studies have established thromboinflammation as a key mediator of ischemic stroke brain damage [6,7]. The hyperglycemia prevalence, defined as blood glucose level > 6.0 mmol/L (or 108 mg/dL), has been commonly observed in two thirds of all ischemic stroke subtypes on admission and in at least 50% in each subtype including lacunar strokes [4,5,8]. It is considered that hyperglycemia facilitates thromboinflammation by exciting the endothelium, neutrophils and platelets [9, 10]. In the setting of stroke, it was shown to weaken post-stroke cerebral blood flow, smash the blood–brain barrier, and cause hemorrhagic transformation [4, 5, 11-14]. Even so, the exact mechanisms underlying these investigations are incompletely understood [7,15, 16]. Brain stroke symptoms and signs may include an inability to move fully, or feel on one side of the body, speaking & understanding problems, or one side vision loss, or dizziness etc. These brain stroke symptoms and signs often appear soon after the stroke has happened. If these symptoms and signs stay less than one or two hours, the brain stroke is a transient ischemic attack (TIA), also known as a mini-stroke. Note that a hemorrhagic stroke may also be related to a severe headache [17,18]. Then these brain stroke symptoms and signs can be extended for a long time. Long-term complications may include loss of bladder control and pneumonia [19, 20]. High blood pressure is the main risk factor for stroke. There are many other risk factors such as high blood cholesterol, obesity, tobacco smoking, diabetes mellitus, atrial fibrillation, end-stage kidney disease, etc. An ischemic stroke is generally caused by a blood vessel blockage, though there are also less common causes [8, 17, 18, 21]. On the other hand, a hemorrhagic stroke is caused by either bleeding into the space between the brain's membranes or directly into the brain. Bleeding may generally occur due to a ruptured brain aneurysm [9, 10, 19-21]. The diagnosis of a brain stroke is generally based on a physical examination, which is supported by medical imaging such as an MRI scan or CT scan. Note that a CT scan can leave out bleeding, but may not necessarily leave out ischemia, which early on generally does not show up on a CT scan. Some other tests such as blood tests and an electrocardiogram (ECG) are performed to locate the risk factors and leave out the other possible causes. Also, low blood sugar may cause the same symptoms. Many earlier studies have focused on the blood glucose (GLU) level effects on the brain stroke patients using simple bivariate correlation, meta-analysis, multiple regression analysis, and machine learning techniques etc. [2,4,5, 8,17, 19, 21]. The current data set is a physiological data set, which is generally heteroscedastic in nature. The previous reports do not consider that the considered brain stroke data set is of a heteroscedastic nature. So, most of the earlier reports invite many debates and doubts. Moreover, the previous reports do not use any appropriate model fitting diagnostic tools on their final selected models, which may be doubtful. So, the research may not have a good faith on all the outcomes related to the earlier doubtful models. The roles of average blood glucose levels on the brain stroke patients are very few investigated based on probabilistic modeling. The current report searches for the following research hypotheses.
• Is there any association of GLU levels with cardiac risk factors, physical and lifestyle factors for brain stroke patients?
• If it is affirmative, how can we derive the most probable GLU levels association model?
• What is the most probable GLU levels statistical model?
• What are the effects of GLU levels on the brain stroke patients?
The current report searches the above research hypotheses considering the following sections such as materials & methods, statistical analysis & results, discussions, and conclusions. The current derived GLU levels statistical model is shown in Table 1 using the considered data set that is reported in the materials section. The statistical GLU levels mean and variance models are developed by joint generalized linear models (JGLMs), which is shortly reported in the methods section. The current derived outcomes are illustrated in the results section, while the present results are illustrated in the discussion section. Based on the present derived GLU levels mean and variance statistical models, the present report has drawn some necessary information that are reported in the conclusions section.
2. Materials and Methods
2.1 Materials
The current GLU levels statistical model is derived herein from a subset of 750 random sample objects out of 4981 brain stroke and normal sample units. The present considered brain-stroke (a medical condition) data set is available in the site- https://www.kaggle.com/datasets/jillanisofttech/brain-stroke-dataset/data The data set contains basically normal subjects and patients of the brain strokes, which are mainly two types, one is stroke ischemic, due to lack of blood flow, and the other is hemorrhagic, due to bleeding. These two types of brain strokes cause parts of the brain to stop functioning properly. The current considered brain stroke data set contains 11 study characters such as gender (or sex) (male=0; female=1), age, hypertension (HYP) (no hypertension=0, hypertension=1), heart disease (HRT) (no heart disease= 0, heart disease =1), ever-married (MAR) (no married=0; married=1), work type (WOK) (Govt job=1; private=2; self-employed=3; children=0), residence-type (RES) (rural=0; urban=1), average glucose level in blood (GLU), body mass index (BMI), smoking-status (SMO) (never smoke=1; former=1; smoker=3), stroke (STR) (no stroke=0; stroke=1).
2.2 Statistical Methods
The present study considers average blood glucose (GLU) level is the targeted response random variable that is to be modeled with the remaining cardiac, lifestyle and physical characteristics. It is examined that the response GLU level is non-normally and heteroscedastic distributed random variable. The variance of GLU level can’t be stabilized with the help of any suitable transformation, therefore it is modeled in the current article using joint generalized linear models (JGLMs) under both the gamma and log-normal distribution that is clearly described in [22-25]. A detailed discussion about JGLMs is given in the book by Lee, Nelder and Pawitan [22]. JGLMS for both the log-normal and gamma distribution are shortly reported herein. JGLMs for log-normal distribution: For the positive response Yi (=GLU) with E(Yi=GLU) = µi (mean) and Var (Yi=GLU) = µi2 = say, where ’s are dispersion parameters and V () reveals the variance function. Generally, log transformation Zi = log (Yi=GLU) is adopted to stabilize the variance Var (Zi) ≈, but the variance may not always be stabilized [26]. For developing a GLU improved model, JGLMs for the mean and dispersion are considered. For the response GLU, assuming log-normal distribution, JGL mean and dispersion models (with Zi = log (Yi=GLU)) are as follows:
E(Zi)= µzi and Var (Zi) = σzi2,
µzi=xit β and log (σzi2) = git γ,
where xit and git are the explanatory factors/variables vectors of GLU associated with the mean regression coefficients β and dispersion regression coefficients γ, respectively.
JGLMs for gamma distribution: In the above stated Yi’s (=GLU), the variance has two portions such as (based on the mean parameters µi’s) and (free of µi’s). The variance function V () displays the GLM family distributions. For instance, if V () = 1, it is normal, Poisson if V () =, and gamma if V () = etc. Gamma JGLMs means and dispersion models of GLU are as follows: and, where and are the GLM link functions attached with the mean and dispersion linear predictors respectively, and, are the explanatory factors/variables vectors of GLU attached with the mean and dispersion parameters respectively. Maximum likelihood (ML) method is used for estimating the mean parameters, while the restricted ML (REML) method is applied for estimating the dispersion parameters, which are explicitly stated in the book by Lee, Nelder and Pawitan [22].
3. Statistical analysis & Results
3.1 Statistical Analysis
The report aims to derive the effects of average blood glucose (GLU) levels on the brain stroke patients. Probabilistic model of GLU levels has been derived on the remaining 10 explanatory variables such as heart disease related parameters (hypertension (HYP), subject’s heart disease status (HRT), subject’s stroke status (STR)), physical parameters (SEX or GEN, AGE, BMI), social & lifestyle parameters (residence type (RES), work type (WRK), ever married (MAR), smoking status (SMO)). Final GLU levels model has been accepted based on the smallest Akaike information criterion (AIC) value (within each class) that reduces both the squared error loss and predicted additive errors [27, p. 203--204]. Based on the AIC rule, JGLMs Log-normal fit (AIC= 6387.836) is better than gamma fit (AIC=6413.285). Table 1 presents the summarized JGLMs results of the GLU levels analysis of both the mean and variance models under both the log-normal and gamma distribution.
In both the mean and variance models some insignificant marginal effects such as SEX (or GEN), SMO, HYP (in mean model) and AGE, BMI (in variance model) are included in the Log-normal fitted model due to the marginality rule of Nelder [28]. According to the marginality of Nelder [28], if any higher order interaction effect is significant, then all its lower order interaction effects and marginal effects should be included in the model. For example, in the Log-normal fitted mean model (Table 1), SEX*SMO is significant (P=0.0078), so the insignificant marginal effects SEX (P=0.7704) and SMO (P=0.2132) should be included in the model. Similarly, for other insignificant effects in the final selected Log-normal model. The generated GLU levels Log-normal fitted probabilistic JGLM (Table 1) is a data derived model that is to be examined by model checking tools. All the valid conclusions about GLU levels are obtained from the data derived Log-normal fitted GLU levels probabilistic model (Table 1) that should be taken based on appropriate graphical diagnostic tools, which is displayed in Figure 1. Figure 1(a) presents the absolute residuals plot for the Log-normal fitted GLU levels model (Table 1) with respect to the fitted values, which is almost flat linear except the right tail, indicating that variance is constant with the running means. Note that the right tail is little increasing as a large absolute residual value is located at the right boundary. Figure 1(b) reveals the normal probability plot for the Log-normal fitted GLU levels mean model (Table 1) that does not reflect any lack of fit. So, both the figures 1(a) and (1b) do not show any discrepancy in the Log-noraml fitted GLU levels model (Table 1). The above Figure 1(a) and Figure 1(b) confirm that the Log-normal fitted GLU levels model is an approximate form of the unknown true GLU levels model.

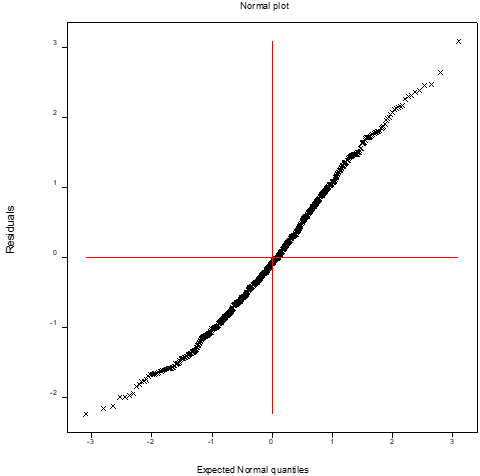
Figure 1: For the joint Log-normal fitted models of average glucose level in blood (glucose) (Table 1), the (a) absolute residual plot with the fitted values, and (b) the normal probability plot for mean model.
3.2 Results
Table 1 displays the summarized results. Based on AIC rule, Log-normal fitted JGLM gives better results than Gamma fitted model. So, the final selected GLU levels model is Log-normal fitted JGLM. There are some discrepancies between these two fitted GLU levels models (in Table 1). The general discrepancies between Log-normal and Gamma fitted models are well discussed in [29, 30]. Herein the Log-normal fitted (Table 1) outcomes are presented, as its AIC value is lower than the Gamma fit.
The associations between the mean GLU levels and heart disease related parameters are illustrated in the following lines. It is derived herein that mean GLU levels is positively associated with the joint interaction effect (JIE) of age and stroke (STR) i.e., AGE*STR (P=0.0432), while both the marginal effects AGE (P=0.0004) and stroke (STR) (P=0.0942) are negatively associated with the mean GLU levels. Mean GLU levels is negatively associated with the JIE of smoking status (SMO) and hypertension (HYP) i.e., SMO*HYP (P=0.0206), while both the marginal effects SMO (P=0.2132) and HYP (P=0.1681) are insignificant. Mean GLU levels is negatively associated with the JIE of ever married (MAR) and subject’s heart disease status (HRT) i.e. MAR*HRT (P<0 P=0.0002), P=0.0261), P=0.0295), P=0.1681). The P=0.0032), P=0.0004) P=0.0.0090). P=0.0078), P=0.7704) P=0.2132). P=0.0004) P=0.0002). P=0.0037), P=0.0090) P=0.0002). P=0.0427), P=0.0295) P=0.2132). P=0.0327). P=0.0001), P=0.0022). P=0.0327), P=0.0022) P=0.0123). P=0.0789), P=0.0739) P=0.1561). P=0.0010), P=0.0022) P=0.1561). P=0.0579), P=0.0022) P=0.8337). xss=removed xss=removed> Model Covariates LOG-NORMAL FIT GAMMA FIT estimate s.e. t(618) P-value estimate s.e. t(618) P-value Mean constant 5.0861 0.1783 28.526 <0> 5.1904 0.1817 28.563 <0> age -0.0123 0.0034 -3.559 0.0004 -0.0137 0.0035 -3.964 <0> bmi -0.0162 0.0062 -2.621 0.0090 -0.0183 0.0063 -2.906 0.0038 age*bmi 0.0003 0.0001 2.962 0.0032 0.0004 0.0001 3.286 0.0011 gen 2 -0.0100 0.0342 -0.292 0.7704 -0.0076 0.0348 -0.218 0.8275 smoking 2 0.0642 0.0515 1.246 0.2132 0.0726 0.0525 1.382 0.1675 gen 2*smoking 2 -0.1448 0.0543 -2.667 0.0078 -0.1587 0.0552 -2.876 0.0042 stroke 2 -0.2124 0.1267 -1.676 0.0942 -0.2479 0.1273 -1.947 0.0520 emarried 2 -0.5640 0.1484 -3.799 0.0002 -0.6891 0.1508 -4.569 <0> age*emarried 2 0.0056 0.0014 4.038 <0> 0.0072 0.0014 5.146 <0> age*stroke 2 0.0041 0.0020 2.026 0.0432 0.0045 0.0020 2.196 0.0285 hypert 2 0.1114 0.0807 1.380 0.1681 0.1487 0.0788 1.887 0.0596 smoking 2*hypert 2 -0.2251 0.0970 -2.321 0.0206 -0.2525 0.0946 -2.667 0.0078 heartd 2 0.6517 0.1223 5.328 <0> 0.6898 0.1174 5.875 <0> emarried 2 *heartd 2 -0.5672 0.1435 -3.953 <0> -0.5794 0.1384 -4.187 <0> bmi*emarried 2 0.0135 0.0046 2.911 0.0037 0.0160 0.0047 3.421 0.0007 resi 2 -0.0718 0.0329 -2.182 0.0295 -0.0762 0.0336 -2.271 0.0235 smoking 2 *resi 2 0.1063 0.0523 2.031 0.0427 0.1135 0.0532 2.135 0.0331 hypert 2 *resi 2 0.2135 0.0957 2.230 0.0261 0.2080 0.0934 2.227 0.0263 Dispersion constant -1.901 0.691 -2.75 0.0061 -1.786 0.686 -2.61 0.0093 age -0.0124 0.0087 -1.42 0.1561 -0.0137 0.0087 -1.58 0.1146 bmi -0.0047 0.0219 -0.21 0.8337 -0.0060 0.0217 -0.28 0.7796 hypert 2 2.419 0.524 4.61 <0> 2.314 0.513 4.51 <0> heartd 2 0.453 0.211 2.14 0.0327 0.385 0.207 1.86 0.0634 gen 2 -0.634 0.354 -1.79 0.0739 -0.680 0.351 -1.94 0.0528 age*gen 2 0.0108 0.0061 1.76 0.0789 0.0115 0.0061 1.89 0.0592 emarried 2 -2.369 0.773 -3.07 0.0022 -2.246 0.766 -2.93 0.0035 age*emarried 2 0.0294 0.0089 3.29 0.0010 0.0295 0.0089 3.32 0.0009 hypert 2 *emarried 2 -2.136 0.554 -3.86 0.0001 -2.098 0.542 -3.87 0.0001 bmi*emarried 2 0.0458 0.0241 1.90 0.0579 0.0426 0.0239 1.78 0.0756 stroke 2 -1.208 0.481 -2.51 0.0123 -1.232 0.477 -2.59 0.0098 emarried 2 *stroke 2 1.078 0.504 2.14 0.0327 1.076 0.499 2.15 0.0319 AIC 6387.836 6413.285
Table 1: Results for mean and dispersion models for glucose from Log-normal & Gamma fit.
4. Discussions
The summarized GLU levels analysis outcomes are displayed in Table 1. Based on Table 1, the most appropriate GLU levels Log-normal fitted mean and variance models are displayed in the above results section. These two GLU level models show the different complicated associations of GLU levels with heart disease related risk factors and along with the other physical, social and life-style factors. These different associations of GLU levels are discussed in the following paragraphs. It is derived herein that mean GLU levels is positively associated with the JIE of age and STR i.e., AGE*STR (P=0.0432), while both the marginal effects AGE (P=0.0004) and STR (P=0.0942) are negatively associated with the mean GLU levels. This indicates that if GLU levels increase as the joint effect of AGE*STR also increases. In other words, it implies that for higher GLU levels subjects have greater brain stroke effects at older ages. It is noted that if the joint effect is significant, the marginal effects are unimportant. Therefore, the role of marginal effects is not discussed when the joint effect is significant. Mean GLU levels is negatively associated with the JIE of SMO (never smoke=1; former=1; smoker=2) and HYP (no hypertension=0, hypertension=1) i.e., SMO*HYP (P=0.0206), while both the marginal effects SMO (P=0.2132) and HYP (P=0.1681) are insignificant. This implies that GLU levels increase when the joint effect of smoking and hypertension (i.e. SMO*HYP) decreases. It shows that subjects with lower effect of SMO*HYP may have higher GLU levels. Mean GLU levels is negatively associated with the JIE of MAR (no married=0; married=1), and subject’s HRT (no heart disease= 0, heart disease =1) status i.e. MAR*HRT (P<0 P=0.0002), hypertension=0, hypertension=1) rural=0; urban=1) P=0.0261), P=0.0295), P=0.1681). This P=0.0032), P=0.0004) P=0.0.0090). male=0; female=1) smoke=1; former=1; smoker=2) P=0.0078), P=0.7704) P=0.2132). P=0.0004) P=0.0002). P=0.0037), P=0.0090) P=0.0002). P=0.0427), P=0.0295) P=0.2132). P=0.0327). P=0.0001), P=0.0022). P=0.0327), P=0.0022) P=0.0123). P=0.2132) P=0.0206), P=0.0078), P=0.0427) P=0.0090) P=0.0032) P=0.0037)>
5. Conclusions
The current article has derived the effects of GLU levels on the brain stroke patients along with the heart disease related factors, other physical, social and lifetime factors. The fitted GLU levels probabilistic model has been selected herein based on the smallest AIC rule, on comparison of joint Log-normal and Gamma models, standard error of the estimates and graphical diagnostic checking plots (Figure 1). Table 1 shows both the Log-normal and Gamma fitted models with similar interpretations. The interpretations about the effects of GLU levels on the brain stroke patients have been discussed above based on the fitted Log-normal model. Most of the derived findings herein focus on the real facts that are observed in practice. The obtained findings regarding GLU levels effects on the brain stroke patients herein though not completely eventual but are expressive. Modern scientific research methods should have complete faith on these obtained findings as the fitted models have been selected with graphical diagnostic checking and comparison of two different models.
The fitted GLU levels models (Table 1) are derived from the data set as reported in the material section. For any similar data sets of GLU levels on the brain stroke patients, the findings will be almost similar to the present findings, which are not verified herein as similar data sets are not available. The current outcomes reveal many real facts, which are rarely reported in the earlier articles. Most of the findings in the report are completely new in the brain stroke literature. In addition, the report may help all the people, brain stroke patients, medical practitioners and researchers. It is concluded that GLU levels have very complex functional roles (Table 1) on the brain stroke patients that should be known to the practitioners for appropriate treatment processes. For all common people, the report informs about the controlling of GLU levels, BMI and smoking at older ages.
Abbreviations
AIC Akaike information criterion
BMI Body mass index
GLU Average blood glucose
HYP Hypertension
HRT Heart disease
JIE Joint interaction effect
JGLMs Joint generalized linear models
MAR Ever married
RES Residence type
SMO Smoking
STR Brain stroke
TIA Transient ischemic attack
Declarations:
The article is an original interesting research report that has been prepared based on advance statistical data analysis using, which has not been submitted in any journal for publication.
Acknowledgement:
The authors are very grateful to the principal data investigators, who provided the data freely for scientific study.
Funding:
The authors declare no financial support for the research, authorship, or publication of this article.
Author contributions:
Conceptualization, R.D. M.D. S.B.; methodology, R.D. D.S.G and S.B.; software, R.D. G.B., A.A; validation, R.D. and M.D.; formal analysis, R.D., G.B.; investigation, R.D. and S.B.; resources, M.D.; data curation, G.B.; writing—original draft preparation, R.D.; writing—review and editing, R.D. and S.B.; visualization, R.D. and D.S.G.; supervision, M.D.; project administration, R.D.; funding acquisition, S.B.; All authors have read and agreed to the published version of the manuscript.
Conflict of interest:
The authors confirm that this article content has no conflict of interest.
Ethical approval:
Note that the current study has been performed based on a secondary data set, which is available in the site- https://www.kaggle.com/datasets/jillanisofttech/brain-stroke-dataset/data The ethics approval and the subject consents are not required for a secondary published data set.
Data availability statement:
The data is available in the site- https://www.kaggle.com/datasets/jillanisofttech/brain-stroke-dataset/data
Informed consent statement
Not applicable
Sample availability
The authors declare no physical samples were used in the study
References
- Williams L.S., Rotich J., Qi R., et al. (2002). Effects of admission hyperglycemia on mortality and costs in acute ischemic stroke. Neurology, 59:67-71
View at Publisher | View at Google Scholar - Desilles J.P., Meseguer E., Labreuche J., et al. (2013). Diabetes mellitus, admission glucose, and outcomes after stroke thrombolysis. Stroke, 44: 1915-1923
View at Publisher | View at Google Scholar - Denorme F, Portier I, Kosaka Y. et al. (2021). Hyperglycemia exacerbates ischemic stroke outcome independent of platele glucose uptake, J. Thrombosis and Haemostasis, 19(2): 536-546.
View at Publisher | View at Google Scholar - Liu Y, Li, J. Guo H. et al. (2024). Nanomaterials for stroke diagnosis and treatment. iScience 27, 111112.
View at Publisher | View at Google Scholar - Klijn CJM, Hankey GJ. (2003). Management of acute ischaemic stroke: new guidelines from the American Stroke Association and European Stroke Initiative. Lancet Neurol. 2:698–701.
View at Publisher | View at Google Scholar - De Meyer S.F., Denorme F., Langhauser F., Geuss E., Fluri F., Kleinschnitz C. (2016). Thrombo-inflammation in stroke brain damage. Stroke. 47: 1165-1172.
View at Publisher | View at Google Scholar - Desilles JP., Syvannarath V., Ollivier V., et al. (2017). Exacerbation of thromboinflammation by hyperglycemia precipitates cerebral infarct growth and hemorrhagic transformation. Stroke. 48:1932-1940.
View at Publisher | View at Google Scholar - Baird TA, Parsons MW, Phanh T, Butcher KS, Desmond PM. et al. (2003). Persistent poststroke hyperglycemia is independently associated with infarct expansion and worse clinical outcome. Stroke. 34:2208–2214.
View at Publisher | View at Google Scholar - Manne B.K., Münzer P., Badolia R., et al. (2018). PDK1 governs thromboxane generation and thrombosis in platelets by regulating activation of Raf1 in the MAPK pathway. J. Thrombosis and Haemostasis, 16: 1211-1225.
View at Publisher | View at Google Scholar - Kraakman M.J., Lee M.K., Al‐Sharea A., et al. (2017). Neutrophil‐derived S100 calcium‐binding proteins A8/A9 promote reticulated thrombocytosis and atherogenesis in diabetes. J. Clin. Invest, 127: 2133-2147.
View at Publisher | View at Google Scholar - Lindsberg PJ, Kaste M. (2003). Thrombolysis for ischemic stroke. Curr Opin Neurol. 16:73–80.
View at Publisher | View at Google Scholar - Chamorro A., Brown S., Amaro S., et al. (2019). Glucose modifies the effect of endovascular thrombectomy in patients with acute stroke. Stroke, 50: 690-696.
View at Publisher | View at Google Scholar - Yamagishi S.I., Edelstein D., Du X.L., Brownlee M. (2001). Hyperglycemia potentiates collagen‐ induced platelet activation through mitochondrial superoxide overproduction. Diabetes, 50:1491-1494.
View at Publisher | View at Google Scholar - Capes SE, Hunt D, Malmberg K, Pathak P, Gerstein HC. (2001). Stress hyperglycemia and prognosis of stroke in nondiabetic and diabetic patients: a systematic overview. Stroke. 32:2426–2432.
View at Publisher | View at Google Scholar - Yan S., Du F., Wu L., et al. (2016). F1F0 ATP Synthase‐Cyclophilin D interaction contributes to diabetes‐induced synaptic dysfunction and cognitive decline. Diabetes, 65: 3482-3494.
View at Publisher | View at Google Scholar - Tang W.H., Stitham J., Gleim S., et al. (2011). Glucose and collagen regulate human platelet activity through aldose reductase induction of thromboxane. J. Clin. Invest. 121: 4462-4476.
View at Publisher | View at Google Scholar - Murphy S. JX and Werring D J. (2023). Stroke: causes and clinical features. Medicine, 51(9): 692-607.
View at Publisher | View at Google Scholar - O'Donnell MJ, Chin L, Rangarajan S. et al. (2016). Global and regional effects of potentially modifiable risk factors associated with acute stroke in 32 countries (INTERSTROKE): a case-control study. The Lancet, 388: 761-775.
View at Publisher | View at Google Scholar - 19.. Yue C, Dong H, Xie A. et al. (2025). Body mass index and all-cause mortality in US stroke population: a cohort study. BMC Neurology, 25:259.
View at Publisher | View at Google Scholar - Jayanama K, Theou O, Godin J, Mayo A, Cahill L. et al. (2022). Relationship of body mass index with frailty and all-cause mortality among middle-aged and older adults. BMC Med. 20(1):404.
View at Publisher | View at Google Scholar - Koliaki C, Dalamaga M, Liatis S. (2023). Update on the obesity epidemic: after the sudden rise, is the upward trajectory beginning to flatten? Curr Obes Rep. 12(4):514–527.
View at Publisher | View at Google Scholar - Lee Y, Nelder JA, Pawitan Y. (2017). Generalized Linear Models with Random Effects (Unified Analysis via H–likelihood) (Second Edition). London: Chapman & Hall.
View at Publisher | View at Google Scholar - Das RN, Lee Y. (2009). Log-normal versus gamma models for analyzing data from quality-improvement experiments. Quality Engineering; 21(1): 79-87.
View at Publisher | View at Google Scholar - Qu Y, Tan M, Rybicki L. (2000). A unified approach to estimating association measures via a joint generalized linear model for paired binary data. Communications in Statistics – Theory and Methods; 29:143–156.
View at Publisher | View at Google Scholar - Lesperance ML, Park S. (2003). GLMs for the analysis of robust designsvwith dynamic characteristics. Journal Quality Technology; 35:253–263.
View at Publisher | View at Google Scholar - Myers, R. H., Montgomery, D. C., Vining, G. G. (2002). Generalized Linear Models with Applications in Engineering and the Sciences. New York: John Wiley & Sons.
View at Publisher | View at Google Scholar - Hastie T, Tibshirani R, Friedman J. (2001). The Elements of Statistical Learning, Springer-Verlag.
View at Publisher | View at Google Scholar - Nelder JA. (2012). The statistics of linear models: back to basics. Statistics and Computing; 4:221–234.
View at Publisher | View at Google Scholar - Das RN. (2012). Discrepancy in fitting between log-normal and gamma models: An illustration. Model Assisted Statistics and Applications; 7 (1) 23–32.
View at Publisher | View at Google Scholar - Das RN and Park JS. (2012). Discrepancy in regression estimates between Log-normal and Gamma: Some case studies. Journal of Applied Statistics; 39(1): 97-111.
View at Publisher | View at Google Scholar
