

Research article | DOI: https://doi.org/10.31579/2834-5126/014
The Effect of Dissolved Natural Organic Matter (NOM) on the Photocatalytic Removal of 4-Chloro-2-Methylphenoxyacetic Acid (MCPA) Endocrine Disrupting Compound from the Surface Water using Carbon Nanotubes/Titanium Dioxide (CNT-TiO2) Nanocatalysts
1 Dokuz Eylül University, Engineering Faculty, Department of Environmental Engineering, Tınaztepe Campus,35160 Buca/Izmir, Turkey.
*Corresponding Author: Delia Teresa Sponza, Dokuz Eylül University, Engineering Faculty, Department of Environmental Engineering, Tınaztepe Campus, 35160 Buca/Izmir, Turkey.
Citation: Rukiye Öztekin, Delia Teresa Sponza, (2023), The Effect of Dissolved Natural Organic Matter (NOM) on the Photocatalytic Removal of 4-Chloro-2-Methylphenoxyacetic Acid (MCPA) Endocrine Disrupting Compound from the Surface Water using Carbon Nanotubes/Titanium Dioxide (CNT-TiO2) Nanocatalysts, Clinical Trials and Clinical Research. 2(4); DOI:10.31579/2834-5126/014
Copyright: © 2023, Delia Teresa Sponza. this is an open access article distributed under the creative commons’ attribution license, which permits unrestricted use, distribution, and reproduction in any medium, provided the original work is properly cited.
Received: 25 July 2023 | Accepted: 07 August 2023 | Published: 16 August 2023
Keywords: anova statistical analysis; carbon nanotubes/titanium dioxide (cnt/tio2) nanocatalysts; 4-chloro-2-methylphenoxyacetic acid (mcpa)
Abstract
In this study, carbon nanotubes/titanium dioxide (CNT/TiO2) nanocatalysts was examined for the effect of dissolved natural organic matter (NOM) on the photocatalytic removal of 4-chloro-2-methylphenoxyacetic acid (MCPA) endocrine disrupting compound from the different water bodies and in herbicide manufacturing industry wastewater. Different CNT/TiO2 nanocatalysts volume ratios (8%, 10%, 15% and 20%), increasing CNT/TiO2 nanocatlaysts volume ratio concentrations (1 mg/l, 2 mg/l, 5 mg/l, 10 mg/l and 15 mg/l), different pH values (4.0, 7.0, 10.0 and 11.0), increasing NOM concentrations (0.5 mg/l, 2 mg/l, 5 mg/l, 10 mg/l and 25 mg/l), increasing phosphate (PO4-3) concentrations (1 mg/l, 5 mg/l and 10 mg/l), increasing bicarbonate (HCO3-) concentrations (1 mg/l, 5 mg/l and 10 mg/l) was operated during photocatalytic degradation process with ultraviolet-visible (UV-vis) irradiation on the photocatalytic removal of 4-chloro-2-methylphenoxyacetic acid (MCPA) endocrine disrupting compound from the different water bodies and in herbicide manufacturing industry wastewater. The characteristics of the synthesized CNT/TiO2) nanocatalysts were assessed using Field Emission Scanning Electron Microscopy (FESEM), Raman Spectroscopy, Photoluminescence (PL) Spectroscopy, X-Ray Photoelectron Spectroscopy (XPS), X-Ray Difraction (XRD) and Fourier Transform Infrared Spectroscopy (FTIR) analyses, respectively. ANOVA statistical analysis was used for all experimental samples. The removal efficiency of 4-chloro-2-methylphenoxyacetic acid: 100% for 10 vol% CNT/TiO2 nanocatalysts, 80% for 1 vol%CNT/TiO2 nanocatalysts, 55% for TiO2 fiber, 15% for TiO2 nanoparticle were shown at 50 W/m2 UV power, after 300 min photocatalytic degradation time, at pH=7.0 and at 25oC, respectively. The maximum 99.99% 4-chloro-2-methylphenoxyacetic acid removal yields was observed at 10 mg/l 10% VOL CNT/TiO2 nanocatalysts, after 300 min photocatalytic degradation time, at 25oC, respectively. Clearly shows that a 5 mg/l 10% VOL CNT/TiO2 nanocatalysts leads to the best 4-chloro-2-methylphenoxyacetic acid removal > 99.90% after only 25 min of photocatalytic degradation time at pH=7.0, at 25oC, respectively. The maximum 99% of 4-chloro-2-methylphenoxyacetic acid removal efficiency was obtained at 0.5 mg/l NOM concentration, at 1 mg/l PO4-3 concentration and 1 mg/l HCO3- concentration, after 300 min photocatalytic degradation time, at pH=7.0 and at 25oC, respectively. The maximum 99% of 4-chloro-2-methylphenoxyacetic acid removal efficiency was observed at 10 mg/l PO4-3 concentration and at 10 mg/l HCO3- concentration, the presence of 10 mg/l NOM concentration, after 300 min photocatalytic degradation time, at pH=7.0 and at 25oC, respectively. The synthesis and optimization of CNT/TiO2 heterostructure photocatalyst provides insights into the effects of preparation conditions on the material’s characteristics and performance, as well as the application of the effectively designed photocatalyst in the removal of MCPA known as endocrine disrupting compound, which is a frequently encountered pollutant in different water bodies and in herbicide manufacturing industry wastewater treatment. Finally, the combination of a simple, easy operation preparation process, excellent performance and cost effective, makes this CNT/TiO2 heterostructure photocatalyst a promising option during photocatalytic degradation process in herbicide manufacturing industry wastewater treatment.
Introduction
In recent decades, many micropollutants, including pharmaceuticals, antibiotics, herbicides, pesticides, personal care products, etc., have been frequently detected in different water bodies worldwide. Although the presence of those contaminants in the aquatic environment is usually at trace concentrations ranging from ng/l to μg/l,undesirable effects on the ecosystems are usually associated: many previous studies have pointed out that those contaminants imposes potential hazards to aquatic life at different levels, from algae to fish, even at low concentrations.[1-5]. Vast efforts have been devoted to developing techniques for their removal, among which TiO2 photocatalysis have received increasing research interests. The principles of TiO2 photocatalytic techniques have been described in literature which was initiated by generation of electron/hole (e−/h+) pairs via excitation by photons with energy higher than the band gap energy of TiO2. Subsequently, the photogenerated electrons and holes are able to participate in direct redox reactions with target organic contaminants. [6-8]. Besides, the photo-generated electrons and holes can also react with oxygen, water, or OH− to generate reactive oxidative species (ROS), e.g hydroxyl radicals (OH●), superoxide radical anions (O2− ●), etc. Those in-situ generated ROS are able to react with many pollutants and the contribution of specific ROS depends on the properties of specific pollutant.[8]. Examples of its application in micropollutants removal are abundant in literature. [9-11].
However, it is also well documented that commonly present dissolved natural organic matter (NOM) in water bodies is a major limiting factor that imposes significant inhibitory effect on micropollutants removal performance of TiO2 photocatalytic techniques. Such inhibitory effect of NOMs can be attributed to three main facts. Firstly, the NOMs present in water matrices act as the “inner UV filter”. NOMs have strong absorption in UV and near UV range, so the presence of NOMs in water would decrease the availability of UV light for TiO2 to produce ROS, thus decreasing the ROS and h+ production. This “inner UV filter” effect is dependent on the wavelength of photons, in general stronger “inner UV filter” effect is expected in shorter wavelength UV range. [12]. Secondly, NOM can also act as scavenger of OH● and h+,which are known as the primary oxidants in TiO2 photocatalytic systems. [13,14]. Thirdly, NOMs can inhibit the target pollutant degradation via competitive adsorption on the TiO2 surface. [15]. The inhibitory effect of NOM on TiO2 based photocatalytic micropollutants removal processes has been documented in previous studies on TiO2 slurry systems. For instance, Brame et al. [16]. conducted a mechanistic study on the inhibitory effect of NOMs on TiO2 slurry system, and a mechanistic model was developed which suggesting the competitive adsorption by NOMs and ROS scavenging were the most influential inhibitory mechanisms. A recent work presented by Peng et al. [17]. suggested that the reactivity of TiO2 nanoparticles could change significantly after long exposure to natural water, because: (1) a NOM layer can be formed on and cap the TiO2 particles surface via adsorption; (2) the adsorbed NOM layer can act as ROS scavenger and subsequently reduce the concentration of ROS in the bulk liquid phase. For TiO2 slurry systems where TiO2 nanoparticles are employed, the presence of NOMs can also interfere with the system performance by changing the stability of the TiO2 nanoparticles. [18]. Focus was given to TiO2 slurry systems, where TiO2 nanoparticles are used, in previous studies on the effect of NOM [19], but regarding real life applications immobilization of TiO2 should be considered to achieve better retention and reuse of the catalyst. The electrochemical anodic produced TiO2 nanotube array (TNA) is a promising option because of its multiple merits: (1) large surface area; (2) high stability; (3) oriented electron transport which can reduce e−/h+ pairs recombination; (4) relatively easy to make and (5) tunable morphologies. Examples of using of TNAs for organic pollutants elimination are available in literature. [18-23]. The change in TiO2 morphology may have an impact on the effect of NOM, but very little is known about the effect of NOM on TNA based photocatalytic system.
In practice, the presence of NOM in water bodies is associated with the presence of inorganics. For example, phosphate, sulfate, bicarbonate, chloride, etc., are the most commonly present inorganic anion species in a broad range of water matrices. The photocatalytic removal of micropollutants by TiO2 photocatalytic processes can also be affected by those co-existing inorganic anions by competitive adsorption and interaction with ROS. [24-26]. In this context, the presence of co-existing inorganic anions may impose impact on the effect of NOMs on a photocatalytic system. In a recent study by Long et al., the change in the detrimental effect of humic acids on photocatalytic performance of TiO2 nanoparticles by the presence of phosphate was reported. [27]. However, the combined effects of NOMs and other commonly present inorganic anions have not been well documented in literature.
The growing anthropogenic impact of an exacerbated consumption of products in recent years has induced a continuous discharge into the environment of wastes and new substances which are increasingly harmful to public, animal, and environmental health. Endocrine Disrupting Compounds (EDCs) are inserted in this group of contaminants of emerging concern as recalcitrant and persistent chemicals, which have been widely and increasingly detected in various water matrices, attracting a great attention due to their toxicity and danger for all ecosystems. [28-30]. Indeed, EDCs are a large and heterogeneous group of natural or synthetic compounds that are progressively known for their adverse consequences on the endocrine system. They can act as substitutes for the hormones, which are an essential part of the suitable functioning of the human and animal organism, mimicking or inhibiting their effects, thus being able to alter their levels and affect the health of the endocrine system as well as of other systems linked to it. [31,32]. Hormonal disturbances caused by EDCs may cause long-lasting and irreversible health problems. Indeed, growing evidence has demonstrated that these compounds contributed to the rapid increase of metabolic syndromes (i.e., insulin resistance, obesity, type 2 and type 1 diabetes, thyroid diseases) and may be associated with an increased incidence of breast cancer, abnormal growth patterns, reproductive abnormalities, and neurodevelopmental delays in children, as well as with changes in immune function. [32].
For these reasons, the presence of EDCs in water and wastewater has become a global problem, drawing the attention of international agencies and governments, as well as of an increasing number of research devoted to the identification [30], and abatement/degradation of EDCs present in waters. [33]. A great deal of attention has been directed towards the development and application of advanced oxidation processes (AOPs) to eradicate EDCs from various water sources with high efficiency, thus leading to an increase of clean water supply. Compared with conventional technologies, materials nanotechnology offers very flexible and efficient remediation options for water pollutants. Nanostructured materials exhibit a range of features, such as high reactivity, large surface area (surface-to-volume ratio), tunable porosity and surface properties, which make them valuable in fields like catalysis, sensing and biomedicine. [34-38]. The growing design of novel nano-catalysts, nano-structured catalytic membranes, and/or nano-sorbents with enhanced efficiency for contaminants removal is a hopeful strategy to contribute solving the worldwide hazardous problem of EDCs water pollution. [29-42].
The model micropollutant compound employed in this study is 4-chloro-2- methylphenoxyacetic acid (MCPA), which is a frequently encountered pollutant in different water bodies including ground water and tap water sources at μg/l level,and in many aqueous wastes including wastewaters from herbicide manufacturing industry at higher concentrations (1–1000 mg/l),and its toxicity and endocrine disrupting effects on living species has been abundantly evidenced in literature. [43,47].
In this study, CNT/TiO2 nanocatalysts was examined for the effect of NOM on the photocatalytic removal of 4-chloro-2-methylphenoxyacetic acid (MCPA) endocrine disrupting compound from the different water bodies and in herbicide manufacturing industry wastewater. Different CNT/TiO2 nanocatalysts volume ratios (8%, 10%, 15% and 20%), increasing CNT/TiO2 nanocatlaysts volume ratio concentrations (1 mg/l, 2 mg/l, 5 mg/l, 10 mg/l and 15 mg/l), different pH values (4.0, 7.0, 10.0 and 11.0), increasing NOM concentrations (0.5 mg/l, 2 mg/l, 5 mg/l, 10 mg/l and 25 mg/l), increasing PO4-3 concentrations (1 mg/l, 5 mg/l and 10 mg/l), increasing HCO3- concentrations (1 mg/l, 5 mg/l and 10 mg/l) was operated during photocatalytic degradation process (UV-vis light irradiation) on the photocatalytic removal of MCPA endocrine disrupting compound from the different water bodies and in herbicide manufacturing industry wastewater. The characteristics of the synthesized CNT/TiO2 nanocatalysts were assessed using FESEM, Raman Spectroscopy, PL Spectroscopy, XPS, XRD and FTIR analyses, respectively. ANOVA statistical analysis was used for all experimental samples.
Materials and Methods
Preparation of CNT/TiO2 Nanocatalysts
Multi walled carbon nanotubes (MWCNTs) with diameters of 12±1 nm was rendered dispersible through oxidative surface functionalisation (by sonication -assisted oxidation at 5 h (300 min) with a 3/1 mixture of concentrated H2SO4/HNO3, creating carboxyl acid groups, followed by extensive washings in water and methanol). The oxidised tubes displayed 8.0±2.0 wt% functionalisation using by thermogravimetric analysis (TGA), corresponding to a theoretical content of 1.4±0.05% COOH/g CNTs.
Photocatalytic Degradation Reactor
The photocatalytic experiments were conducted in a crystallizing dish with a 500 mW UV-LED light source module placed on the top. The UV-LED light source module consisted of a UV-LED (NCSU033B, NICHIA, Japan) and has peak emission wavelength of 365 nm, and an aluminium plate served as heat dispenser. The photocatalytic degradation experiments of MCPA were carried out with a reaction solution volume of 60 ml, with the presence of CNT/TiO2 nanocatalytists (3 cm × 3 cm), at 25oC ambient temperature. The distance between the UV-LED and the surface of CNT/TiO2 nanocatalytists was 2 cm, and the UV-LED radiant power at this distance was 18.6 mW/cm2 measured by a THORLABS S150C radiant power meter (THORLABS, USA). Vigorous mixing was applied as soon as the reaction solution was added into the reactor. Before switching on the UV-LED, the reaction system was kept in dark for 60 min to establish equilibrium of any possible adsorption of MCPA on the CNT/TiO2 nanocatalytists surface. Then the photocatalytic experiments started, for the duration of 120 min. At designated time intervals 1 ml samples were taken, and stored in dark at 4°C until LC–MS/MS (Liquid Chromatography Tandem Mass Spectrometry) analysis. All experiments were carried out in duplicate. Except for experiments conducted in designated acidic or alkaline conditions, all other experiments were conducted with natural initial pH=6.0-7.0, and without pH adjustment. For experiments conducted in designated acidic or alkaline conditions, hydrochloric acid (HCl) or sodium hydroxide (NaOH) aqueous solution were applied to adjust the pH. The experiments were carried out in at 25oC ambient temperature without temperature control.
MCPA Concentration Measurement Procedures
For MCPA concentration measurement, an Agilent LC–MS/MS (Liquid Chromatography Tandem Mass Spectrometry) system consisting of Agilent infinity 1260 LC-system (degasser, binary pump, auto sampler with cooled tray and column oven) and Agilent 6420 triple Quadrupole Mass Spectrometer with Electrospray ion source was used. Detailed information of the analytical method used can be found in literature [48].
Characterization
Field Emission Scanning Electron Microscopy (FESEM)
The morphological features and structure of the synthesized catalyst were investigated by FESEM (FESEM, Hitachi S-4700), to investigate the composition of the elements present in the synthesized catalyst.
Raman Spectra Analysis
The Raman spectra were collected using a Renishaw inVia MicroRaman spectrometer equipped with a charge-coupled device (CCD) detector. Two laser lines were used to excite the samples, 514 nm (green laser) and 785 nm (red laser), the regions of interest being inspected using a 50× objective lens. The scattered light intensity, collected at 90o to the Ar+1 laser excitation beam, was dispersed with a grating of 1800 lines/mm, detected using a Peltier-cooled charge-coupled device (CCD) camera of 578 × 400 pixels. In order to determine the ratio of peak intensity at the D and G bands (ID/IG), ID and IG were obtained from deconvoluted Raman spectra, use being made of OriginPro 2018 sofware; smoothing and baseline correction have been applied on the raw Raman spectra prior to deconvolution. Depth profiles and mapping of selected areas were also obtained with the Raman spectrometer. All the measurements were performed at 25oC room temperature.
Photoluminescence Spectroscopy Analysis
Photoluminescence (PL) measurements were followed through using the Renishaw inVia MicroRaman spectrometer. Use has been made of the system with a 40× objective lens and laser at 325 nm, providing for target excitation. The excitation wavelength of 325 nm was used for PL measurements, experience showing that a choice of higher excitation wavelength would lead to reduction in PL intensity. Te grating system ofers 1200 lines/mm and the PL intensity was detected using a CCD camera of 578 × 400 pixels.
X-Ray Photoelectron Spectroscopy (XPS) Analysis
The valence state of the biogenic palladium nanoparticles was investigated and was analyzed using XPS (ESCALAB 250Xi, England). XPS used an Al Ka source and surface chemical composition and reduction state analyses was done, with the core levels recorded using a pass energy of 30 eV (resolution ≈ 0.10 eV). The peak fitting of the individual core-levels was done using XPS-peak 41 software, achieving better fitting and component identification. All binding energies were calibrated to the C 1s peak originating from C–H or C–C groups at 284.6 eV.
X-Ray Diffraction Analysis
Powder XRD patterns were recorded on a Shimadzu XRD-7000, Japan diffractometer using Cu Kα radiation (λ = 1.5418 Å, 40 kV, 40 mA) at a scanning speed of 1o /min in the 10-80o 2θ range. Raman spectrum was collected with a Horiba Jobin Yvon-Labram HR UV-Visible NIR (200-1600 nm) Raman microscope spectrometer, using a laser with the wavelength of 512 nm. The spectrum was collected from 10 scans at a resolution of 2 /cm. The zeta potential was measured with a SurPASS Electrokinetic Analyzer (Austria) with a clamping cell at 300 mbar.
Fourier Transform Infrared Spectroscopy (FTIR) Analysis
The FTIR spectra of samples was recorded using the FT-NIR spectroscope (RAYLEIGH, WQF-510).
Statistical Analysis
ANOVA analysis of variance between experimental data was performed to detect F and P values. The ANOVA test was used to test the differences between dependent and independent groups, (Zar, 1984). Comparison between the actual variation of the experimental data averages and standard deviation is expressed in terms of F ratio. F is equal (found variation of the date averages/expected variation of the date averages). P reports the significance level, and d.f indicates the number of degrees of freedom. Regression analysis was applied to the experimental data in order to determine the regression coefficient R2, (Statgraphics Centurion XV, 2005). The aforementioned test was performed using Microsoft Excel Program.
All experiments were carried out three times and the results are given as the means of triplicate samplings. The data relevant to the individual pollutant parameters are given as the mean with standard deviation (SD) values.
Results and Discussions
The Results of FESEM Analysis
The morphology of the fibers and the sintered nanostructures was investigated by field emission scanning electron microscopy (FESEM). Figure 1(A) and Figure 1(C) shows the smooth, continuous and randomly oriented fibers of TiO2–CNT (0.2 wt%)–poly vinyl acetate (PVAc) and TiO2–PVAc composites, respectively, obtained by electrospinning. The average diameter of the fibers was ∼200 nm. Figure 1(B) and Figure 1(D) shows uniformly distributed rice grain-shaped nanocomposites of TiO2–CNTs and TiO2 obtained from the nanofibers by sintering at 450oC for 3 h. Sintering results in near collapse of the continuous fiber morphology with the concomitant appearance of the excellently interconnected rice grain-shaped TiO2. It has already been confirmed that the rice grain-like morphology resulted due to the microscale phase separation between TiO2 and the PVAc (owing to the poor solubility of TiO2 in the latter) during the solvent evaporation stage in the sintering process.
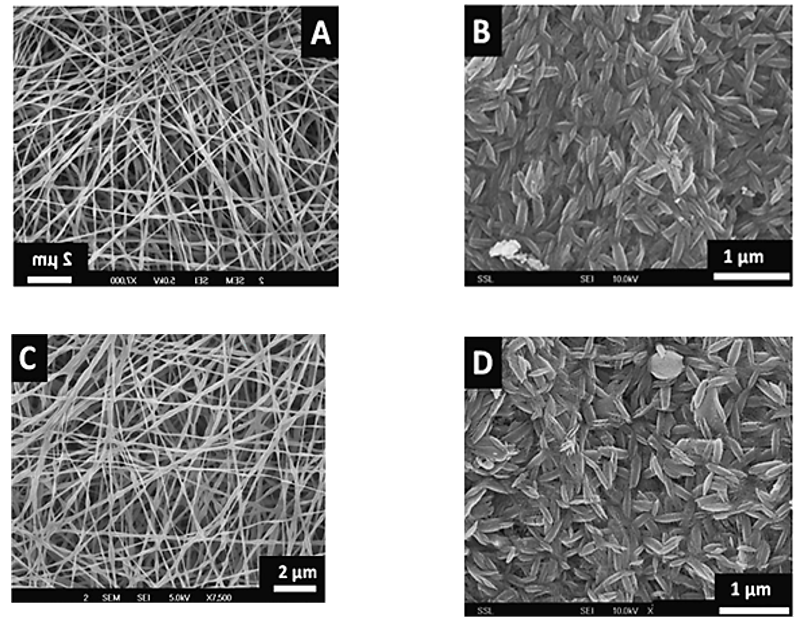
Figure 1: FESEM images of (A) continuous and randomly oriented fibers of TiO2–CNT (0.2 wt%)–poly vinyl acetate (PVAc), (B) rice grain-shaped nanocomposites of TiO2–CNTs obtained from the nanofibers by sintering at 450oC for 3 h, (C) rice grain-shaped TiO2 nanoparticles obtained from the nanofibers by sintering at 450oC for 3 h and (D) continuous and randomly oriented fibers of TiO2–PVAc composites, respectively.
The Results of Raman Spectra Analysis
Next figure shows the Raman spectra for TiO2 fibres, TiO2/CNT hybrid fibres and TiO2 nanoparticles for comparison (Figure 2). All the samples exhibit the five active modes of TiO2, corresponding to 144 (Eg), 198 (Eg), 397 (A1g), 516 (A1g or B1g) and 639 (Eg) cm-1 in bulk anatase. The first two modes present a blue shift, higher for the fibres (6 cm-1) compared to the particles (3 cm-1) and increasing with CNT content (7 cm-1and 10 cm-1) for 1 and 10 vol% of CNTs). While the blue shift is usually related to phonon confinement in small particle sizes the average crystal size of our samples is similar (11 nm –15 nm). Furthermore, it is not clear that such confinement would be present in nanocrystals joined as a mesoporous structure rather than individualized. Instead we attribute the shift in Raman modes to O vacancies due to the sensitivity of the Eg mode to O-O interactions. These defects are likely to involve sharing of oxygen at the interfaces between TiO2 nanocrystals and the TiO2/CNT interface. They can be expected to create inter-bandgap energy levels in the system, similar to those observed in bicontinuous mesoporous TiO2 self-assembled from block copolymers. Photoluminescence (PL) observed in the range 2–3 eV corresponding to emission of excitons associated to surface oxygen vacancies and defects confirms (Figure 2).
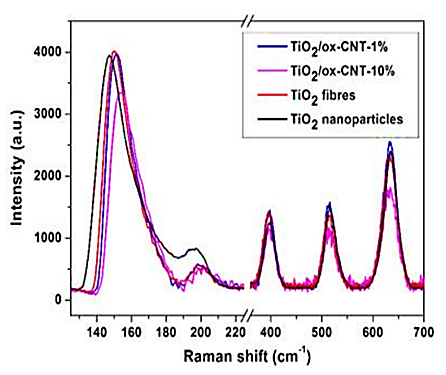 |
Figure 2: Raman spectra for TiO2 fibres, TiO2/CNT hybrid fibres and TiO2 nanoparticles
The Results of Photoluminescence (PL) Spectra Analysis
PL spectra observed in the range 2–3 eV corresponding to emission of excitons associated to surface oxygen vacancies and defects confirms this to be the case in Figure 3.
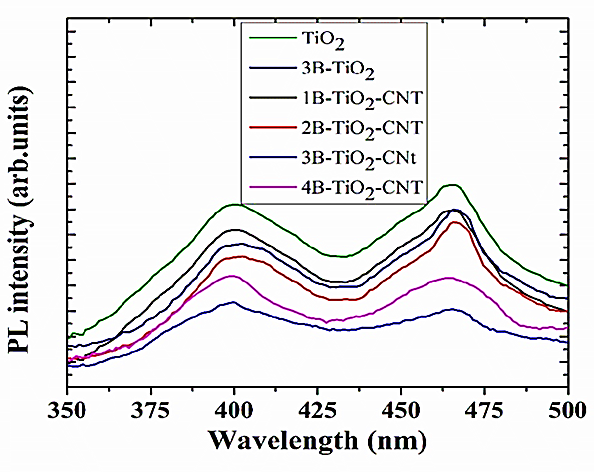 |
Figure 3: PL spectra for TiO2, 3B-TiO2, 1B-TiO2-CNT, 2B-TiO2-CNT, 3B-TiO2-CNT and 4B-TiO2-CNT, respectively.
The Results of XPS Analysis
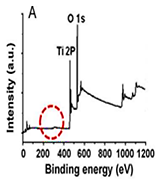
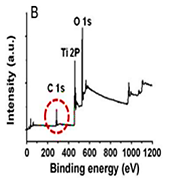
Furthermore, because no partial reduction of Ti4+ to Ti3+ was found in XPS spectra, such levels would be closer to the conduction band edge and would lead to an n-type semiconductor (Figure 4).
 |  |
 |  |
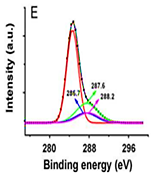 | 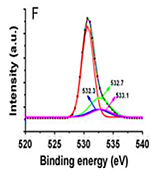 |
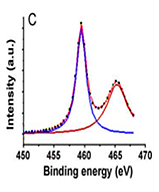
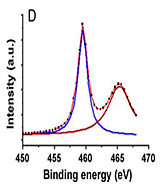
Figure 4: XPS spectra of (A) the rice grain-shaped TiO2 nanocomposites (binding energy=0 - 1200 eV), (B) the rice grain-shaped TiO2–CNT (0.3 wt%) nanocomposites (binding energy=0-1200 eV, (C) the rice grain-shaped TiO2 nanocomposites (binding energy=450-470 eV), (D) the rice grain-shaped TiO2–CNT (0.3 wt%) nanocomposites (binding energy=450-470 eV, (E)the rice grain-shaped TiO2 nanocomposites (binding energy=280 - 296 eV), (F) the rice grain-shaped TiO2–CNT (0.3 wt%) nanocomposites (binding energy=520-540 eV, respectively.Because, no partial reduction of Ti4+ to Ti3+ was found in XPS, such levels would be closer to the conduction band edge and would lead to an n-type semiconductor. The XPS survey spectrum of the rice grain-shaped TiO2 and TiO2–CNT (0.3 wt%) nanocomposites are shown in Figure 4A and Figure 4B, respectively. The elemental composition is assigned in the spectra itself. While the C1 s peak was negligible in the case of TiO2 (which indicates that there were no carbon related impurities left in TiO2 due to polymer degradation), a prominent one can be seen in the case of the composite. C1 s peak in TiO2–CNT composites came directly from the CNTs and not as a result of impurity from the polymer decomposition process. Figure 4shows the high-resolution XPS spectra of Ti 2P of TiO2 and the composite, respectively. The binding energies of Ti 2P 3/2 and Ti 2P½ in bare TiO2 were centered at 459.40 eV and 465.16 eV, respectively, corresponding to a spin–orbit coupling of 5.76 eV. However, the same for TiO2–CNT was slightly upshifted to 459.44 eV and 465.22 eV, respectively (minor differences less than 0.1 eV), which implies that the Ti in the TiO2–CNT composites are in a
slightly different chemical environment than that in TiO2, indicating the chemical interaction between TiO2 and the CNTs (that is primarily between the surface OH groups of the TiO2 and the COOH groups of the functionalized CNTs resolution spectrum of C 1 s (Figure 4E).
The main peak at 284.7 eV could be assigned to C=C and C=C bonds. The broad peak ranging from 284 eV to 292 eV was deconvoluted into three other peaks at 286.7 eV, 287.6 eV, and 288.2 eV, respectively. The minor peaks from 286 eV to 289 eV could be due to the presence of oxidized components from the CNTs. Figure 4F shows the high-resolution XPS spectrum of the O 1 s peak of the composite. The spectrum can also be deconvoluted into four peaks. The main peak at 530.5 eV could be ascribed to the O 1 s of TiO2. The minor peaks at 532.3 eV, 532.7 eV and 533.1 eV, respectively, could be due to the presence of undissociated H2O molecules / OH groups on TiO2 surfaces. Thus, the XPS data indicate the oxidation of CNTs and their successful incorporation into the TiO2 network.
The Results of XRD Analysis
The XRD pattern of TiO2–CNT (0.2 wt%) nanocomposite and the TiO2 nanostructures was given in Figure 5. The XRD patterns also revealed the presence of single-crystalline anatase TiO2. The peaks in the pattern at 25.28o (101), 37.80o (004), 48.18o (200), and 54.09o (105) clearly represent the anatase phase of TiO2 (Figure 5).
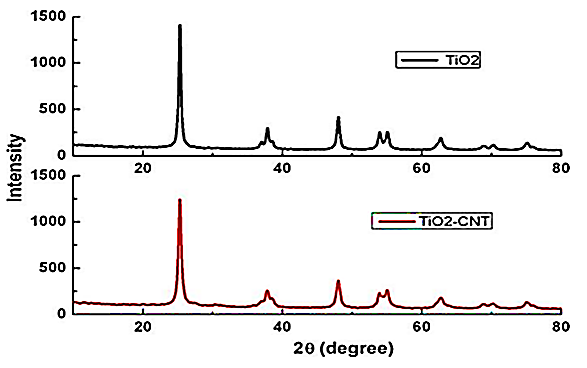 |
Figure 5: XRD pattern of TiO2–CNT (0.2 wt%) nanocomposite and the TiO2 nanostructures, respectively.
The peaks corresponding to CNTs were not obvious in the XRD spectrum of the nanocomposites and is primarily because of two reasons: (1) overlap of (002) reflection of the CNTs at 26.40o with the (101) reflection of anatase at 2θ= 25.30o; (2) low intensity of the CNTs resulted from its low concentration compared to that of TiO2 (0.2 wt% against TiO2) (Figure5).
The Results of FTIR Analysis
Through FTIR spectroscopy we have further characterized the interface in the hybrids. Figure 6 presents FTIR spectra of a hybrid with high amount of functionalized CNTs (40 vol.%) to increase signal intensity from interfacial FTIR modes. Spectra of the functionalized CNTs, and of a sample of TiO2 produced by an identical electrospinning and annealing process, are also included for reference. The signals in the region 1630 cm-1 – 1400 cm−1 in the hybrid confirm the presence of CNTs and indicate that the polymer removal process does not produce apparent damage to the nanotubes.
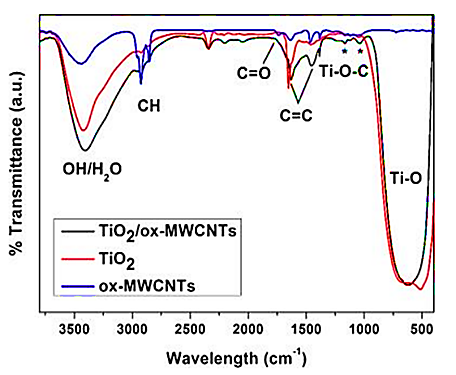
Figure 6: FTIR spectra of TiO2/ox-MWCNTs (40 vol.% CNT) hybrit nanocatalysts, TiO2 nanocomposite and ox-MWCNTs, respectively.
By contrast, as expected, the annealing process in Ar leads to the loss of the CNT functional groups associated with the original oxidative functionalization and also the asymmetric and symmetric C-H stretching at 2930 cm−1 and 2860 cm−1 are notably reduced (Figure 6). More importantly, the hybrid presents signals at 1160 cm−1, 1090 cm−1 and 1030 cm−1 which could correspond to rocking and stretching modes previously assigned to Ti-O-C. CNTs also present weak signals arising from C-O vibrations in this region; however, in the hybrid IR spectrum, we can rule out such peak assignment to the CNT themselves, in light of the expected intensity relative to the CNT fingerprint, and of the absence of the C=O signal in the hybrid FTIR spectrum (Figure 6).
The Effect of Different CNT/TiO2 Nanocatalysts Concentrations for the MCPA Removals Efficiency from Surface Water with Photocatalytic Degradation Process
Effects of 3 g/l 10 vol%CNT/TiO2 nanocatalysts, 1 vol%CNT/TiO2 nanocatalysts, TiO2 fiber and TiO2 nanoparticle concentrations on 5 mg/l 4-chloro-2-methylphenoxyacetic acid removal efficiencies at 50 W/m2 UV power, after 300 min photocatalytic degradation time, at pH=7.0 and at 25oC, respectively (Figure 7). The removal efficiency of 4-chloro-2-methylphenoxyacetic acid: 100% for 10 vol%CNT/TiO2nanocatalysts, 80% for 1 vol%CNT/TiO2 nanocatalysts, 55% for TiO2 fiber, 15% for TiO2 nanoparticle were shown at 50 W/m2 UV power, after 300 min photocatalytic degradation time, at pH=7.0 and at 25oC, respectively (Figure 7).
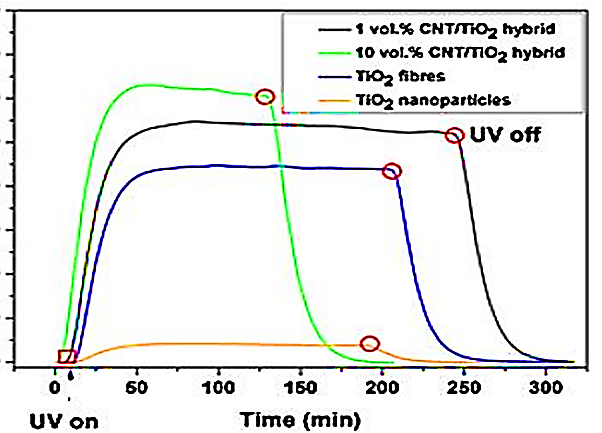 |
Figure 7: The effect of different CNT/TiO2 nanocatalysts concentrations for the MCPA removals efficiency from surface water with photocatalytic degradation process
The maximum 4-chloro-2-methylphenoxyacetic acid removal efficiency were 100% for 10 vol%CNT/TiO2 nanocatalysts, 80% for 1 vol%CNT/TiO2 nanocatalysts, 55% for TiO2 fiber and 15% for TiO2 nanoparticle, respectively, at a 50 W/m2 UV power, after 300 min photocatalytic degradation time, at pH=7.0 and at 25oC, respectively (Figure 7). The charge carrier produced recombines and releases energy in the form of heat. The charge carrier can also react with an electron donor or electron acceptor on the photocatalyst surface. In the first case, no reaction occurs. In the latter case, the electron or hole reacts with dissolved oxygen or water to form superoxide anion (O2 - ●), hydroperoxyl (OOH●) or OH● free radicals.
4-chloro-2-methylphenoxyacetic Acid (MCPA) Photolysis and Photodegradation Process
A photolytic degradation experiment was initially carried out to monitor the removal and mineralization of 5 g/l of 4-chloro-2-methylphenoxyacetic acid without the addition of CNT/TiO2 nanocatalysts and to compare with a photocatalytic experiment using 2 mg/l, 5 mg/l and 10 mg/l of 8% vol. CNT/TiO2 nanocatalysts. (Table 1). After 100 min photocatalytic degradation time, only 28% and 32% of the initial 4-chloro-2-methylphenoxyacetic acid oncentration was removed, whereas 97% and 99% 5 mg/l 4-chloro-2-methylphenoxyacetic acid removal was detected with 2 mg/l 8% VOL CNT/TiO2 nanocatalysts and 3 mg/l of 8% VOL CNT/TiO2 nanocatalysts, after 25 min photocatalytic degradation time, at pH=7.0 and at 25oC, respectively. (Table 1).
| Removal Efficiency (%) | ||||
| Without 2 mg/l of 8%VOL CNT/TiO2 nanocatalysts | Without 3 mg/l of 8% VOL CNT/TiO2 nanocatalysts | With 2 mg/l of 8%VOL CNT/TiO2 nanocatalysts | With 3 mg/l of 8% VOL CNT/TiO2 nanocatalysts | |
| 5 g/l 4-chloro-2-methylphenoxyacetic acid | 28% with photolysis | 32% with photolysis | 97% with photodegradation | 99% with photodegradation |
Table 1: 5 g/l of 4-chloro-2-methylphenoxyacetic acid without the addition of CNT/TiO2 nanocatalysts and to compare with a photocatalytic experiment using 2 mg/l, 5 mg/l and 10 mg/l of 8% vol. CNT/TiO2 nanocatalysts after 25 min photocatalytic degradation irradiation time, at pH=7.0 and at 25oC, respectively.
Photocatalytic processes remove organic pollutants or hazardous organic compounds from CO2 and it has the potential to oxidize to non-toxic or less harmful products such as water. In addition, in secondary wastewater treatment certain microorganisms, namely bacteria and some they can also destroy viruses.
The Effect of different CNT/TiO2 nanocatalysts Ratios for the Removal of MCPA after Photocatalytic Degradation Process in the Surface Water
The different CNT/TiO2 nanocatalysts volume ratios (8%, 10%, 15% and 20%) and increasing CNT/TiO2 nanocatalysts volume ratios concentrations (2 mg/l, 5 mg/l, 10 mg/l and 15 mg/l) were examined for the MCPA removal efficiency after 300 min photocatalytic degradation time, at pH=7.0 and 25oC, respectively (Table 2). The maximum 99.99% 4-chloro-2-methylphenoxyacetic acid removal yields was observed at 10 mg/l 10% VOL CNT/TiO2 nanocatalysts, after 300 min photocatalytic degradation time, at 25oC, respectively (Table 2).
| CNT/TiO2 Ratios | 4-chloro-2-methylphenoxyacetic acid removal yields (%) |
| 2 mg/l 8% VOL CNT/TiO2 | 66 |
| 2 mg/l 10% VOL CNT/TiO2 | 67 |
| 2 mg/l 15% VOL CNT/TiO2 | 68 |
| 2 mg/l 20% VOL CNT/TiO2 | 69 |
| 5 mg/l 8% VOL CNT/TiO2 | 70 |
| 5 mg/l 10% VOL CNT/TiO2 | 71 |
| 5 mg/l 15% VOL CNT/TiO2 | 72 |
| 5 mg/l 20% VOL CNT/TiO2 | 76 |
| 10 mg/l 8% VOL CNT/TiO2 | 98 |
| 10 mg/l 10% VOL CNT/TiO2 | 99.99 |
| 10 mg/l 15% VOL CNT/TiO2 | 99 |
| 10 mg/l 20% VOL CNT/TiO2 | 99 |
| 15 mg/l 8% VOL CNT/TiO2 | 88 |
| 15 mg/l 10% VOL CNT/TiO2 | 87 |
| 15 mg/l 15% VOL CNT/TiO2 | 80 |
| 15 mg/l 20% VOL CNT/TiO2 | 76 |
Table 2: The effect of different CNT/TiO2 nanocatalysts ratios for the removal of MCPA after photocatalytic degradation process, after 300 min photocatalytic degradation time, at pH=7.0 and 25oC, respectively.
The Effect of Increasing pH Values for the Removal of MCPA after Photocatalytic Degradation Process in the Surface Water
A lot of photocatalytic experiments using 2 mg/l, 5 mg/l, 10 mg/l and 15 mg/l of CNT/TiO2 with 4 different volume (8%, 10%, 15% and 20%) were performed in order to optimize the CNT/TiO2 nanocatalysts concentration. Clearly shows that a 5 mg/l 10% VOL CNT/TiO2 nanocatalysts leads to the best 4-chloro-2-methylphenoxyacetic acid removal > 99.90
Conclusions
We performed the synthesis and structural characterization of CNT/TiO2 hybrid fibres with remarkably enhanced efficiency for photocatalytic decomposition of 4-chloro-2-methylphenoxyacetic acid. For maximum 4-chloro-2-methylphenoxyacetic acid (MCPA) removal efficiency the optimum pH, NOM, CNT/TiO2 nanocatalysts ratio as volume and PO4-3 and HCO3-1 levels were detected.
The removal efficiency of 4-chloro-2-methylphenoxyacetic acid: 100% for 10 vol% CNT/TiO2 nanocatalysts, 80% for 1 vol%CNT/TiO2 nanocatalysts, 55% for TiO2 fiber, 15% for TiO2 nanoparticle were shown at 50 W/m2 UV power, after 300 min photocatalytic degradation time, at pH=7.0 and at 25oC, respectively.
The maximum 99.99% 4-chloro-2-methylphenoxyacetic acid removal yields was observed at 10 mg/l 10% VOL CNT/TiO2 nanocatalysts, after 300 min photocatalytic degradation time, at 25oC, respectively.
Clearly shows that a 5 mg/l 10% VOL CNT/TiO2 nanocatalysts leads to the best 4-chloro-2-methylphenoxyacetic acid removal > 99.90
Acknowledgement
This research study was undertaken in the Environmental Microbiology Laboratories at Dokuz Eylül University Engineering Faculty Environmental Engineering Department, Izmir, Turkey. The authors would like to thank this body for providing financial support.
References
- Hernando, M.D, Mezcua, M, Fernández-Alba, A.R., Barceló, D. (2006). Environmental risk assessment of pharmaceutical residues in wastewater effluents, surface waters and sediments. Talanta, 269:334-342.
View at Publisher | View at Google Scholar - Schwarzenbach, R.P, Escher, B.I, Fenner, K, Hofstetter, T.B, Johnson, C.A, von Gunten, U. (2006). Wehrli, B. The challenge of micropollutants in aquatic systems. Science, 2313:1072-1077.
View at Publisher | View at Google Scholar - Luo, Y, Guo, W, Ngo, H.H, Nghiem, L.D, Hai, F.I, Zhang, J, Liang, S, Wang, X.C. (2014). A review on the occurrence of micropollutants in the aquatic environment and their fate and removal during wastewater treatment. Sci. Total Environ,473-474:619-641.
View at Publisher | View at Google Scholar - Barbosa, M.O, Moreira, N.F.F, Ribeiro, A.R, Pereira, M.F.R, Silva, A.M.T. (2016).Occurrence and removal of organic micropollutants: an overview of the watch list of EU Decision 2015/495. Water Res,94:257-279.
View at Publisher | View at Google Scholar - Verlicchi, P, Al Aukidy, M, Zambello, E. (2012). Occurrence of pharmaceutical compounds in urban wastewater: removal, mass load and environmental risk after a secondary treatment—a review. Sci. Total Environ., 429:123-155.
View at Publisher | View at Google Scholar - Kuipers, J. (2014).Distributed light sources for photocatalytic water treatment, Wageningen University, Wageningen.
View at Publisher | View at Google Scholar - Cavalcante, R.P, Dantas, R.F., Bayarri, B, González, O, Giménez, J, Esplugas, S, Machulek Junior, A. (2015). Synthesis and characterization of B-doped TiO2 and their performance for the degradation of metoprolol. Catal. Today, 252:27-34.
View at Publisher | View at Google Scholar - Cavalcante, R.P, Dantas, R.F, Bayarri, B., González, O, Giménez, J, Esplugas, S, Machulek Junior, A. (2016). Photocatalytic mechanism of metoprolol oxidation by photocatalysts TiO2 and TiO2 doped with 5% B: primary active species and intermediates, Appl. Catal. B,194:111-122.
View at Publisher | View at Google Scholar - Abramović, B.F, Šojić, D.V, Anderluh, V.B, Abazović, N.D, Čomor, M.I.(2009). Nitrogen-doped TiO2 suspensions in photocatalytic degradation of mecoprop and (4-chloro-2-methylphenoxy)acetic acid herbicides using various light sources. Desalination,244:293-302.
View at Publisher | View at Google Scholar - Achilleos, A., Hapeshi, E, Xekoukoulotakis, N.P, Mantzavinos, D, Fatta-Kassinos, D.(2012).Factors affecting diclofenac decomposition in water by UV-A/TiO2 photocatalysis. Chem. Eng. J,161:53-59.
View at Publisher | View at Google Scholar - Arlos, M.J, Hatat-Fraile, M.M, Liang, R., Bragg, L.M, Zhou, N.Y, Andrews, S.A, Servos, M.R. (2016). Photocatalytic decomposition of organic micropollutants using immobilized TiO2 having different isoelectric points. Water Res,101:351-361.
View at Publisher | View at Google Scholar - Ye, Y., Feng, Y, Bruning, H., Yntema, D, Rijnaarts, H.H.M.(2018). Photocatalytic degradation of metoprolol by TiO2 nanotube arrays and UV-LED: effects of catalyst properties, operational parameters, commonly present water constituents, and photo-induced reactive species. Appl. Catal. B,220:171-181.
View at Publisher | View at Google Scholar - Brame, J, Long, M, Li, Q, Alvarez, P.(2014).Trading oxidation power for efficiency: differential inhibition of photo-generated hydroxyl radicals versus singlet oxygen. Water Res, 60:259-266.
View at Publisher | View at Google Scholar - Chen, J, Ollis, D.F, Rulkens, W.H, Bruning, H.(1999). Photocatalyzed oxidation of alcohols and organochlorides in the presence of native TiO2 and metallized TiO2 suspensions. Part (I): photocatalytic activity and pH influence, Water Res,3:661-68.
View at Publisher | View at Google Scholar - Gora, S.L, Andrews, S.A.(2017). Adsorption of natural organic matter and disinfection byproduct precursors from surface water onto TiO2 nanoparticles: pH effects, isotherm modelling and implications for using TiO2 for drinking water treatment. Chemosphere,174:363-370.
View at Publisher | View at Google Scholar - Brame, J, Long, M, Li, Q, Alvarez, P. (2015). Inhibitory effect of natural organic matter or other background constituents on photocatalytic advanced oxidation processes: mechanistic model development and validation. Water Res,84:362-371.
View at Publisher | View at Google Scholar - Peng, H, Chen, Y, Mao, L, Zhang, X. (2017). Significant changes in the photo-reactivity of TiO2 in the presence of a capped natural dissolved organic matter layer. Water Res,110:233-240.
View at Publisher | View at Google Scholar - Erhayem, M, Sohn, M. (2014).Stability studies for titanium dioxide nanoparticles upon adsorption of Suwannee River humic and fulvic acids and natural organic matter. Sci. Total Environ.,468-469:249-257.
View at Publisher | View at Google Scholar - Uyguner-Demirel, C.S, Birben, N.C, M. Bekbolet, M. (2017).Elucidation of background organic matter matrix effect on photocatalytic treatment of contaminants using TiO2: a review. Catal. Today,284:202-214.
View at Publisher | View at Google Scholar - Macak, J.M, Zlamal, M, Krysa, J, Schmuki, P. (2007). Self-organized TiO2 nanotube layers as highly efficient photocatalysts. Small,3:300-304.
View at Publisher | View at Google Scholar - Smith, Y.R, Kar, A, Subramanian, V. (2009). Investigation of physicochemical parameters that influence photocatalytic degradation of methyl orange over TiO2 nanotubes. Ind. Eng. Chem. Res,48:10268-10276.
View at Publisher | View at Google Scholar - Natarajan, T.S, Natarajan, K, Bajaj, H, Tayade, R.J. (2011). Energy efficient UV-LED source and TiO2 nanotube array-based reactor for photocatalytic application. Ind. Eng. Chem. Res,50:7753-7762.
View at Publisher | View at Google Scholar - Marien, C.B, Cottineau, T, Robert, D, Drogui, P. (2016). TiO2 Nanotube arrays: Influence of tube length on the photocatalytic degradation of paraquat. Appl. Catal. B,194:1-6.
View at Publisher | View at Google Scholar - Rincón, A.-G, Pulgarin, C. (2004). Effect of pH, inorganic ions, organic matter and H2O2 on E. Coli K12 photocatalytic inactivation by TiO2: implications in solar water disinfection. Appl. Catal. B,51:283-302.
View at Publisher | View at Google Scholar - Guillard, C, Puzenat, E, Lachheb, H, Houas, A, Herrmann, J.M. (2005).Why inorganic salts decrease the TiO2 photocatalytic efficiency. Int. J. Photoenergy,7:1-9.
View at Publisher | View at Google Scholar - Autin, O, Hart, J, Jarvis, P, MacAdam, J, Parsons, S.A, Jefferson, B. (2013). The impact of background organic matter and alkalinity on the degradation of the pesticide metaldehyde by two advanced oxidation processes: UV/H2O2 and UV/TiO2. Water Res, 47:2041-2049.
View at Publisher | View at Google Scholar - Long, M, Brame, J, Qin, F, Bao, J, Li, Q, Alvarez, P.J.J. (2017). Phosphate changes effect of humic acids on TiO2 photocatalysis: from inhibition to mitigation of electron–hole recombination. Environ. Sci. Technol.,51:514-521.
View at Publisher | View at Google Scholar - Pironti, C, Ricciardi, M, Proto, A, Bianco, P.M, Montano, L, Motta, O. (2021). Endocrine-disrupting compounds: an overview on their occurrence in the aquatic environment and human exposure. Water, 13(10):13-47.
View at Publisher | View at Google Scholar - Vieira, W.T, De Farias, M.B, Spaolonzi, M.P, Da Silva, M.G.C, Vieira, M.G.A. (2021). Latest advanced oxidative processes applied for the removal of endocrine disruptors from aqueous media—a critical report. J. Environ. Chem. Eng,9:105-748.
View at Publisher | View at Google Scholar - Vieira, W.T, De Farias, M.B, Spaolonzi, M.P, Da Silva, M.G.C, Vieira, M.G.A. (2021).Endocrine-disrupting compounds: occurrence, detection methods, effects and promising treatment pathways—a critical review. J. Environ. Chem. Eng, 9:104-558.
View at Publisher | View at Google Scholar - Kabir, E.R., Rahman, M.S, Rahman, I. (2015). A Review on endocrine disruptors and their possible ımpacts on human health. Environ. Toxicol. Pharmacol,40:241-258.
View at Publisher | View at Google Scholar - Schjenken, J.E, Green, E.S, Overduin, T.S, Mah, C.Y, Russell, D.L. Robertson, S.A. (2021). Endocrine disruptor compounds—a cause of impaired ımmune tolerance driving inflammatory disorders of pregnancy? Front. Endocrinol, 2:4:1-15.
View at Publisher | View at Google Scholar - Gao, X., Kang, S, Xiong, R., Chen, M. (2020). Environment-friendly removal methods for endocrine disrupting chemicals. Sustainability, 12:76-15.
View at Publisher | View at Google Scholar - Costantini, A., Venezia, V, Pota, G, Bifulco, A, Califano, V, Sannino, F. (2020). Adsorption of cellulase on wrinkled silica nanoparticles with enhanced inter-wrinkle distance. Nanomaterials,10:17-99.
View at Publisher | View at Google Scholar - Medhi, R, Marquez, M.D, Lee, T.R.(2020). Visible-light-active doped metal oxide nanoparticles: review of their synthesis, properties, and applications. ACS Appl. Nano Mater,3:6156-6185.
View at Publisher | View at Google Scholar - Selvaraj, M., Hai, A, Banat, F, Haija, M.A.(2020). Application and prospects of carbon nanostructured materials in water treatment: a review. J. Water Process Eng,33:100-996.
View at Publisher | View at Google Scholar - Singh, K.R, Nayak, V, Singh, J, Singh, A.K, Singh, R.P. (2021). Potentialities of bioinspired metal and metal oxide nanoparticles in biomedical sciences. RSC Adv, 11:24722-24746.
View at Publisher | View at Google Scholar - Yoon, Y, Truong, P.L, Lee, D, Ko, S.H. (2022). Metal-oxide nanomaterials synthesis and applications in flexible and wearable sensors. ACS Nanosci. Au,2(2):64-92.
View at Publisher | View at Google Scholar - Bilal, M., Rasheed, T, Mehmood, S, Tang, H, Ferreira, L.F.R, Bharagava, R.N, Iqbal, H.M.N. (2020). Mitigation of environmentally related hazardous pollutants from water matrices using nanostructured materials—a review. Chemosphere, 253:126-770.
View at Publisher | View at Google Scholar - Lu, F, Astruc, D. (2020). Nanocatalysts and other nanomaterials for water remediation from organic pollutants. Coord. Chem. Rev, 408:2131-2180.
View at Publisher | View at Google Scholar - Ojha, A, Tiwary, D, Oraon, R, Singh, P. (2021). Degradations of endocrine-disrupting chemicals and pharmaceutical compounds in wastewater with carbon-based nanomaterials: a critical review. Environ. Sci. Pollut. Res,28:30573-30594.
View at Publisher | View at Google Scholar - González-González, R.B, Parra-Arroyo, L, Parra-Saldívar, R., Ramirez-Mendoza, R.A, Iqbal, H.M.N. (2022). Nanomaterial-based catalysts for the degradation of endocrine-disrupting chemicals—a way forward to environmental remediation.Mater. Lett,308:131-217.
View at Publisher | View at Google Scholar - Harrison, I, Leader, R.U, Higgo, J.J.W, Williams, G.M. (1998).A study of the degradation of phenoxyacid herbicides at different sites in a limestone aquifer. Chemosphere,36:1211-1232.
View at Publisher | View at Google Scholar - Vione, D, Khanra, S, Das, R., Minero, C, Maurino, V, Brigante, M, Mailhot, G. (2010). Effect of dissolved organic compounds on the photodegradation of the herbicide MCPA in aqueous solution. Water Res,44:6053-6062.
View at Publisher | View at Google Scholar - Diaz, E, Cebrian, M, Bahamonde, A, Faraldos, M, Mohedano, A.F, Casas, J.A, Rodriguez, J.J. (2016). Degradation of organochlorinated pollutants in water by catalytic hydrodechlorination and photocatalysis. Catal. Today,266:168-174.
View at Publisher | View at Google Scholar - Orton, F, Lutz, I, Kloas, W, Routledge, E.J. (2009). Endocrine disrupting effects of herbicides and pentachlorophenol: in vitro and in vivo evidence. Environ. Sci. Technol,43:2144-2150.
View at Publisher | View at Google Scholar - Tufi, S, Wassenaar, P.N.H, Osorio, V, de Boer, J, Leonards, P.E.G, Lamoree, M.H. (2016). Pesticide mixture toxicity in surface water extracts in snails (Lymnaea stagnalis) by an in vitro acetylcholinesterase inhibition assay and metabolomics. Environ. Sci. Technol,50:3937-3944.
View at Publisher | View at Google Scholar - Butkovskyi, A, Jeremiasse, A.W, Hernandez Leal, L, van der Zande, T, Rijnaarts, H, Zeeman, G. (2014). Electrochemical conversion of micropollutants in gray water. Environ. Sci. Technol,48:1893-1901.
View at Publisher | View at Google Scholar
