

Research Article | DOI: https://doi.org/10.31579/2835-785X/041
The Design and Simulation of an Electroencephalography (EEG) Device to Detect, Record and Analysis the Brain Signals
- Hamidreza Shirzadfar *
- Melika Kiani
- Mitra Fakhari
Department of Electrical and Biomedical Engineering, Faculty of Engineering and Technology, Shahid Ashrafi Esfahani University, Isfahan, Iran.
*Corresponding Author: Hamidreza Shirzadfar, Department of Electrical and Biomedical Engineering, Faculty of Engineering and Technology, Shahid Ashrafi Esfahani University, Isfahan, Iran.
Citation: Hamidreza Shirzadfar, Melika Kiani, and Mitra Fakhari, (2023), The Design and Simulation of an Electroencephalography (EEG) Device to Detect, Record and Analysis the Brain Signals, International Journal of Clinical Research and Reports. 3(1); DOI:10.31579/2835-785X/041
Copyright: © 2024, Hamidreza Shirzadfar. This is an open-access artic le distributed under the terms of the Creative Commons Attribution License, which permits unrestricted use, distribution, and reproduction in any medium, provided the original author and source are credited.
Received: 01 February 2024 | Accepted: 12 February 2024 | Published: 21 February 2024
Keywords: electroencephalography; brain waves; electrical signals; brain activity
Abstract
Due to its wealth of information, which includes the ability to diagnose brain disorders, research on the electrical activity of the brain has drawn the interest of scientists and researchers worldwide as the study of the human body has advanced. Furthermore, many scientists are attempting to resolve the controversy surrounding the existence or absence of electrical activity in the brain by employing electroencephalography (EEG) device. In the current era of scientific and technological advancements, new methods have been employed to investigate how the human brain functions. One such method involves using an EEG device to record the electrical activity of the brain.
This article first discusses the meaning of electroencephalography and the waves that occur in the brain. It then introduces a circuit that can be used to receive brain signals and analyze each circuit component in turn. The application of the EEG signal is greatly impacted by understanding its origin and production, as will be discussed below.
Introduction
The nervous system is in charge of the electrochemical process that transfers messages from the brain to other areas of the human body. Because the human body uses electricity to send messages, it can be studied, its activity monitored, and verified, just like any other electrical system. Electroencephalography is the process of recording brain electrical activity. It involves the use of surface electrodes for signal acquisition, signal improvement (typically amplification and noise reduction), signal printing and analysis, and the final product, an electroencephalogram.
Using internal electrodes taken from the surface of the brain cortex, Caton recorded the EEG signal for the first time in 1875 [1]. However, Hans Berger was the first to record the EEG signal using surface electrodes from the skull's surface; he did so in 1929 and reported on the signal's variations during sleep and other conditions [2]. The electroencephalogram is the only piece of information that can instantly provide data about the state and activity of the brain.
The EEG signal amplitude that is recorded from the skin usually ranges from 10 to 100 µv, and it rarely goes above 50 µv. The amplitudes of the signals obtained from within the cortex range from 500 to 1500 µv. This demonstrates how the cortex's primary functions pass through the fatty layers of the skin, bone, spinal fluid, etc. require the proper amplifiers because they filter and significantly reduce the main signal [3].
This project's goals are to examine the workings of the EEG device and design its circuit, which makes use of an amplifier, three active low-pass filters, an active high-pass filter, a notch filter, and an active pre-amp. The definitions of each circuit component have been covered in detail.
Materials & Methods
The various rhythms of the EEG signal are contingent upon various sensory and movement conditions. Acknowledging every beat in this signal takes a great deal of expertise and proficiency. The rhythm and waveform of the EEG varies depending on where the electrode is positioned in the brain because the waves and rhythms of the EEG signal only appear in specific locations on the head and under specific circumstances.
Even when we sleep, the brain stays active and emits different waves due to the activity of neurons in various situations; In the gamma state of the brain, the most active waves are alpha, beta, theta, delta, and gamma waves. The frequency and intensity of the waves decrease to reach the delta wave, which is the sleep state. Through the analysis of multiple subjects' brain waves, researchers have demonstrated that different mental disorders are associated with either an overactive or underactive brain wave.
In general, 5 different types of brain waves have been identified:
Types of EEG waves:
- Normal individuals were found to exhibit rhythmic alpha waves in the 8–13 Hz range when they were relaxed and alert, with their eyes closed. Although the occipital region is where these waves are typically recorded, the forehead and parietal regions can also record these waves.
- Beta waves have frequencies between 14 and 50 Hz and are produced in people with intense brain activity, anxiety, and open eyes. They can be recorded in the frontal and parietal regions of the brain.
- Theta waves are waves that have frequencies between 4 and 7 Hz that are detected in the brain's regional and temporal areas. These waves are most commonly seen in adults and children who are depressed or under mental stress.
- Delta waves, which fall between 3 and 5 Hz, are seen in deep sleep, in newborns, and in certain brain disorders.
- Of all the brain waves, gamma waves have the highest frequency; the brain is at its most focused during this phase. The frequency range of gamma waves is 40–140 Hz [4].
In Figure 1, you can see the brain waves in order.
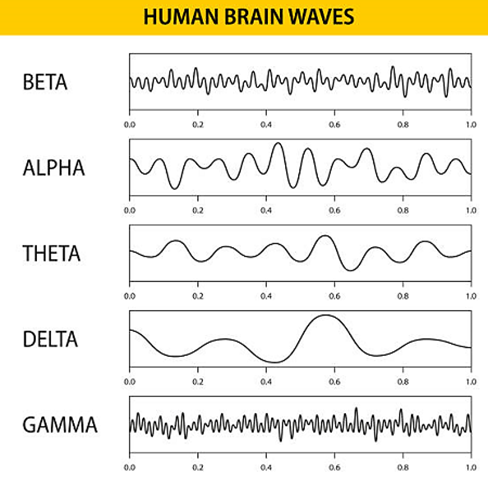
Figure 1: Types of brain waves [5].
An electrode arrangement method is acknowledged as an international standard to quantify brain activities and compare brain signal recording outcomes. This worldwide configuration of electrodes is referred to as the 20-10 standard. This system's naming comes from the division of the linear distances between the forehead and the back of the head, as well as between the right and left temples, into two parts of 10% and four parts of 20%. Nearly every part of the head can be covered with electrodes; the electrodes are chosen based on specific locations on the skull bone. The left side of the brain is represented by odd numbers, and the right side by even numbers. The frontal lobe is represented by the letter F, its poles by the letter Fp, the temporal lobe by the letter T, the occipital lobe by the letter O, the center and corporeal sensory cortex by the letter C, and the middle line dividing the right and left by the letter Z. Figure 2 illustrates where these electrodes are positioned [6].
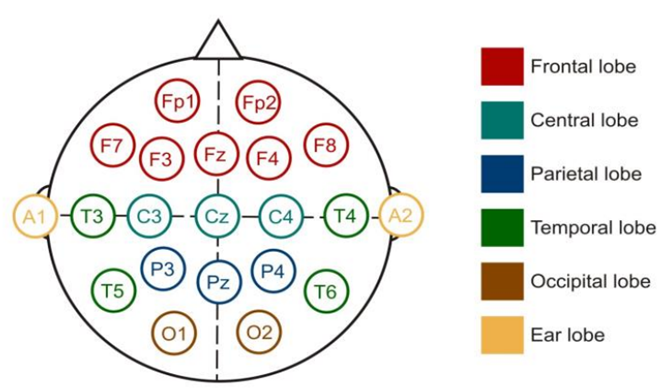
Figure 2: Electrode arrangement with international standard 10-20 [7].
As shown in the diagram in Figure 3, the designed system mainly consists of scalp electrodes, instrumentation amplifier, active high-pass filter, active low-pass filter and 50 Hz notch filter and monitor. The outline of this circuit is drawn on Proteus and since the signal captured by the EEG device is weak, we need to amplify the signal by several orders of magnitude to perform proper signal processing. Therefore, first send the signal through an instrument amplifier. However, sufficient gain may not be achieved with one amplifier stage, and with multiple adjustable gain stages, higher resolution when receiving the signal can be achieved. At this point, the EEG must have amplified the signal sufficiently to apply filters and various signal processing techniques [8].
The primary frequencies in the recorded EEG signal are approximately 10Hz; additionally, any possible signal noise has to be eliminated. Brainwave signals have been extracted using a low-pass filter because noise typically consists of high-frequency components followed by low-frequency components. After that, the output signal ought to be able to be recorded and displayed on the oscilloscope.
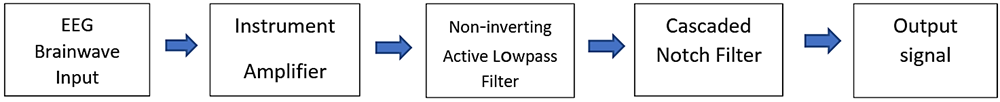
Figure 3: Block diagram of EEG detection processes.
Simulation & Results
Instrumentation amplifier in EEG:
The input signals shared by both input leads are attenuated and the difference signal is amplified by the instrumentation amplifier. An important problem is the noise produced in the instrument amplifier input leads by the (Ag/Cl) electrodes and electrode cables that are too close to one another. This amplifier has a very low offset voltage of about 100 µv and is set to gain about 100 times; therefore, it can remove noise because it can reject the common input signals in both inputs. The DC component cannot be set to a value greater than that (power supply is -/+5 v). The instrument amplifier AD620 is used; it has high input impedance, low power consumption (1.5 mv at 3 v), and a portable design, making it suitable for use in medical instruments [10]. The schematic layout of the complete EEG circuit is displayed in Figure 4.
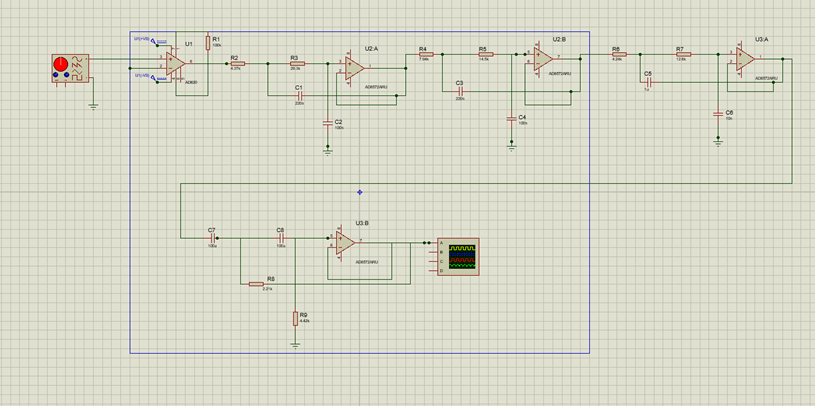
Figure 4: Block diagram of EEG detection processes.
It is necessary for the system to pre-process the signal using a filter capable of removing interfering signals. So, we designed three filters including an active high pass filter, an active low pass filter and a 50Hz notch filter.
Figure 5 shows the circuit design for the active low-pass filter, which is used in the first stage of the circuit design. This filter concentrates more on lower-frequency brain activity, such as activity linked to alpha and theta waves, and eliminates information about high-frequency activity that isn't necessary. In EEG, applying a low-pass filter can enhance signal quality and make data interpretation easier. Three second-order filters with known filter coefficients and capacitor values of 220 and 100 n are taken into consideration for Butterworth's 6th order low-pass filter. This design makes use of the AD8572 opamp. These filters feature low input bias current (10 pA), high gain, and low offset. The filter has a cutoff frequency of 100 Hz at a gain of -3 dB. In Figure 5, the filter is displayed [11].
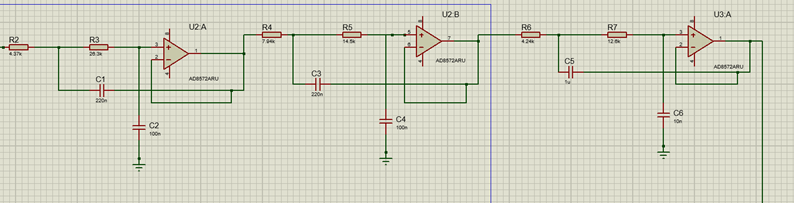
Figure 5: Low pass filter circuit design.
In the second step, a high-pass filter is used to eliminate low-frequency signals and select only higher-frequency signals. These signals include activities at different frequencies, including low-frequency activities such as breathing-related activities, muscle movements, and environmental sounds. Generally, the high-pass cutoff frequency value is set to 1 Hz, so that lower frequencies such as ambient noise and activities related to breathing can be eliminated. Using this filter can significantly improve signal quality and data interpretation. Figure 5 shows the structure of this filter [1, 11].
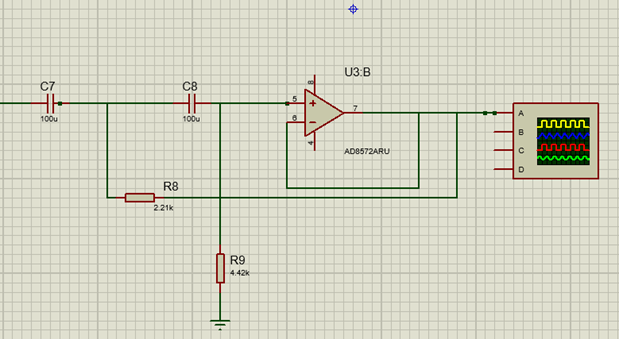
Figure 6: High-pass filter circuit design.
The third stage uses the Notch Active 50 Hz filter, a filter to remove or reduce signals with a certain frequency that can enter the EEG device from noise sources such as the power grid or electrical devices. By using the notch filter as a band-stop filter, it is possible to remove or reduce certain frequencies that are usually associated with disturbing noise in EEG. To implement this notch filter, the AD8572 operational amplifier is used [2, 11]. Figure 7 shows the designed circuit of the notch filter.
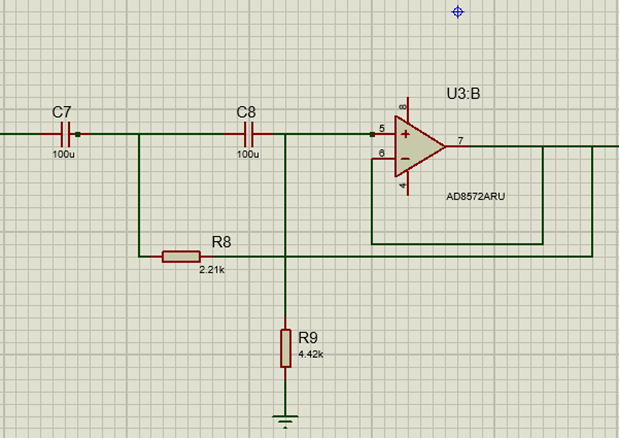
Figure 7: High-pass filter circuit design.
Although the amplifier in the pre-amplifier circuit of the EEG signals is still at the mV level after the voltage range stage, the necessity of the amplifier circuit beyond this point is emphasized. Although the post-stage circuit is only amplified 5–10 times, the entire system magnifies 100,000–200,000 times. As a result, it is adjustable, which increases the system's practicality. Figure 8 displays the circuit schematic diagram [3, 11].
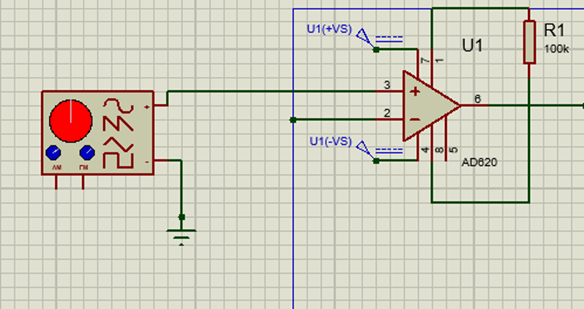
Figure 8: The schematic of pre-amplifier circuit.
Designing an analog signal with a gain of 5000 VN and no noise involves simulating the circuit. This signal, which is depicted in Figure 4, must be moved to a microcontroller analysis platform in order to be transformed from an analog to a digital signal. The eight multiplex channels in the ADC of the Atmega 32 microcontroller have a resolution of ten bits apiece. The Atmega 32 operates at a frequency of 16MHz and 125KHz in this ADC clock system [12-14]. Lastly, the ADC value must be fixed between 50 and 200 kHz. The oscilloscope screen displays the desired EEG signal in accordance with these settings. Figures 10-13 presents the input and output signal of EEG designed device before and after amplification.
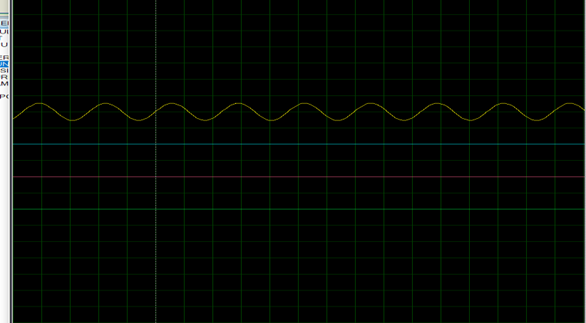
Figure 9: The input signal display of device.
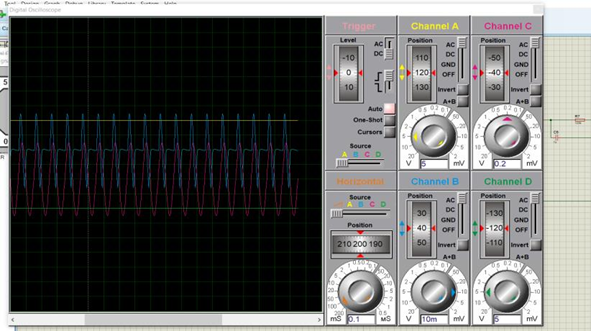
Figure 10: The initial signal amplification display.
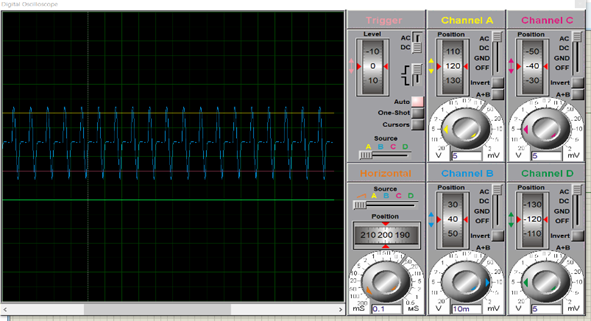
Figure 11: The output signal displayed on oscilloscope
Conclusion
Both nationally and internationally, there may be varying versions of standards and regulations pertaining to EEG devices. Usually, the purpose of these rules and regulations is to guarantee the precision, safety, and uniformity of these devices' application. The circuit was designed using the Proteus program, and the electrodes are based on the international standard system 10–20. Neurophysiological research indicates that changes in brain states brought on by external stimuli can be reflected in brain rhythms. Furthermore, accuracy is typically expressed in µv. In applications such as medical research, the device's weight and dimensions are critical. The EEG system's precise analysis of this data helps medical professionals and researchers to derive meaningful conclusions. In general, the vital EEG signal monitoring device's design and construction are significant because they capture alterations in brain signals and facilitate the diagnosis of various brain illnesses.
References
- References
View at Publisher | View at Google Scholar
