

Review ariticle | DOI: https://doi.org/10.31579/2835-7957/086
The Balombo Project (Angola). A long-term village-scale malaria vector control program, comparing four methods: long-lasting insecticide-treated nets alone, insecticide-treated plastic sheeting alone or combined with long-lasting insecticide-treated
- Pierre Carnevale 1*
- Jean-Claude Toto 2
- Vincent Foumane 2
- Filomeno Fortes 3
- Almeida Ingles 4
- Alcides Soyto 4
- Guillaume Carnevale 5
1Director of Research, Jalan Raya Sakah, Batuan, Sukawati, Bali, Indonesia, 80582.
2OCEAC (Organisation of Coordination for Endemic Diseases Control in Central Africa), Yaoundé, Cameroon.
3Director, Tropical Medicine Institute, Lisbon, Portugal.
4Malaria Control Program, Medical Department, Sonamet®, Lobito, Angola.
5Hygiene Safety Environment, Batuan, Bali, Indonesia.
*Corresponding Author: Pierre Carnevale, Director of Research, Jalan Raya Sakah, Batuan, Sukawati, Bali, Indonesia, 80582.
Citation: Pierre Carnevale, Jean-Claude Toto, Vincent Foumane, Filomeno Fortes, Almeida Ingles, et al, (2024), The Balombo Project (Angola). A long-term village-scale malaria vector control program, comparing four methods: long-lasting insecticide-treated nets alone, insecticide-treated plastic sheeting alone or combined with long-lasting insecticide-treated nets, or following two rounds of indoor residual spraying. I. First entomological and parasitological evaluation, Clinical Reviews and Case Reports,
Copyright: © 2024, Pierre Carnevale. This is an open-access article distributed under the terms of the Creative Commons Attribution License, which permits unrestricted use, distribution, and reproduction in any medium, provided the original author and source are credited.
Received: 15 November 2024 | Accepted: 28 November 2024 | Published: 02 December 2024
Keywords: angola, anopheles; durable lining; indoor residual spraying; long-lasting insecticide -treated nets; malaria vector control; malaria transmission; plasmodium prevalence; parasitaemia and gametocytes
Abstract
Study Design
A long-term, village-scale malaria vector control project, beginning in 2007, and scheduled for eleven years, was implemented in eight villages around Balombo town (Benguela Province, Angola) to compare the epidemiological efficacy of four methods, each one implemented in two villages: Long-lasting insecticide-treated nets, PermaNet® 2.0, alone; durable lining model ZeroFly® in association with PermaNet®; durable lining model ZeroVector® alone and durable lining following two rounds of lambdacyhalothrin indoor residual spraying (one model of treated plastic sheeting per village.)
Methodology
The project was done in complete natural conditions, planned and implemented in three successive phases: a) First five years: simultaneous regular field surveys with entomological, parasitological, and immunological evaluation in the eight villages (two years before vector control, done in December 2008, and three years after); b) Five years more: long-term regular parasitological evaluation in four villages (each with one vector control method) with regular cross-sectional surveys on symptomless children ≤15 years old; c) One final overall parasitological survey in the eight villages in February 2018, compared to the plasmodial infections in February 2008.
During the first five years, three entomological indicators and three parasitological indicators were analyzed, before and after vector control: the number of main vectors (Anopheles gambiae and An. funestus) caught by CDC Light traps; their infectivities and the inoculation rate, and, simultaneously, Plasmodium prevalence, parasitaemia, and gametocyte index in symptomless children ≤15 years old.
Results
A total of 202 CDC “catching sessions” were done, representing 1,880 “trap-nights.” 1,153 Anopheles were captured, belonging to 11 species. The main vectors (“MV”) were An. funestus and An. gambiae. After implementation of vector control, the densities of MV per trap dropped by 70%, similarly with all four methods. Infectivity of vectors dropped from 4.53%, (n= 375), to 2.73% (n=183), a noteworthy, if not significant, 43% reduction.
Inoculation rates decreased similarly by some 80% after the implementation of each one the four vector control methods.
A total of 190 surveys were performed; Plasmodium were noticed in 5,330 of the 20,188 thick blood films examined, i.e. an overall Plasmodium prevalence of 26.4%, and gametocytes in 553, i.e. a gametocyte index of 2.74%. P. falciparum was largely preponderant with few P. malariae.
After vector control, Plasmodium prevalence, parasitaemia, and gametocytes index were significantly reduced, similarly by each method.
An important impact was noticed the first two years after vector control and less the third year, but still noticeable with the combination of long-lasting insecticide-treated nets and ZeroFly® durable lining.
Entomological and parasitological data were remarkably consistent underlining the interest of such combined protocol.
Conclusion
Durable lining alone was as efficient as house spraying while having a longer-lasting effect. Combinations of methods were not much better than methods implemented alone. The initial great acceptability of durable lining by communities was confirmed
1.Introduction
In Angola malaria is still a main public health problem, even if “the accuracy of malaria prevalence estimates in Angola has traditionally been somewhat compromised by incomplete reporting, inability to test due to stock-outs of the necessary materials, and other logistic challenges.” (1, 2, 3)
Malaria outbreaks have been occurring in several central-coastal provinces since 2015, with the highest numbers reported in 2016 and 2017 (4) and some recurrence were still observed in some areas. (5)
Due to the presence of drug resistant P. falciparum strains (6, 7) vector control is needed, but a recent house-spraying campaign was a failure (8) and the National Malaria Control Program focused on increasing the scale of distribution of long-lasting insecticide-treated nets (LLINs).
On the other hand, in villages near Balombo town, it was observed that withdrawal of used LLINs was common, with more than 50% of nets previously distributed being already torn and discarded within two years (9), emphasizing the need for a new vector control method. Such behavior was reported elsewhere (10).
Therefore, special attention was devoted to the recently developed tool called “insecticide treated plastic sheeting” (ITPS) (or “durable lining” or “wall lining”) (11) to be tested in Angola, where some studies on its acceptability had already been done (12) while the epidemiological impact in the region was still missing.
Several studies have recently been devoted to the efficacy, and acceptability, of this new tool, in refugee camps (13, 14) and in experimental huts, alone (15) or in combination with LLIN (16, 17, 18). Organophosphate-treated ITPS was used in combination with LLIN against pyrethroid-resistant An. gambiae in Côte d’Ivoire (19), while carbamate-treated ITPS was used in combination with deltamethrin-treated LLIN for controlling pyrethroid-resistant An. gambiae in Southern Benin (16).
ITPS was recently tested in Nigeria (12) and in several other countries in Africa, and Asia (20). Some operational issues were identified (21, 22).
Acceptability of durable lining was studied in Papua New Guinea (23) as well as in Equatorial Guinea, Ghana, Mali, South Africa, and Vietnam (20).
The model called “ZeroFly®,” with a higher concentration of deltamethrin than other models, was successfully tested in India (24, 25).
Considering these positive data, and the issues related to house-spraying and use of nets, a long-term village-scale malaria vector control program was requested by the National Malaria Control Program of Angola to compare the efficacy and acceptability of ITPS (two models), used either alone, or in combination with LLIN model PermaNet® 2.0, or following two rounds of indoor residual spraying with lambdacyhalothrin (26).
The project was done in complete natural conditions, planned and implemented in three phases: a) First five years: simultaneous regular field surveys with entomological, parasitological, and immunological evaluation in the eight villages identified by the National Program (two years before vector control done in December 2008 and three years after); b) Five years more: long-term parasitological evaluation with regular cross-sectional surveys in four villages (one for each vector control method implemented); c) One final overall parasitological survey in the eight villages, in February 2018, the results of which were then compared to the plasmodial infections in February 2008.
This document presents the entomological and parasitological data obtained with simultaneous surveys regularly performed the first five years. Parasitological data gained during the six following years are presented in the next document. Final cross-sectional surveys done ten years after vector control implementation is presented in the third document.
2. Materials and Methods
2-1. Study sites
The National Malaria Control Program (NMCP) selected eight villages in the Balombo municipality, in the Benguela Province of central Angola (12°21’S; 14°46’E), 150 km east of Lobito town and 600 km southeast of Luanda, the national capital. The eight villages were far enough from each other to avoid any contamination by mosquitoes actively flying from one village to another, which would bias entomological evaluation.
Balombo is in a humid, mountainous area at an altitude of 1,200 meters, with fast-running rivers and tropical savannah forests that have been greatly damaged to facilitate their use for agricultural purposes. The weather is characterized by a long rainy season (October to May) and a short cold dry season (June to September). The biotope was already presented. (26, 27)
According to the stratification of malaria burden in Angola, the Balombo area and the rest of the Benguela Province, belong to the “Tropical Zone” with hyper-to mesoendemic malaria.(5)
Traditional houses are rectangular, built with locally made adobe bricks (and abandoned brick pits remained often unfilled, and could constitute suitable breeding sites for An. gambiae inside the village) with thatched roofs or, more and more, corrugated iron roofs. The average surface area of walls inside the house was around 50 square meters. A house is usually composed of two rooms: the first one, at the entrance, is used as “kitchen” and “dining room”, when it is raining, and, the evening, as sleeping place for children after mats, or anything used as “sleeping unit” (cardboard, loincloth etc.) are deployed. The second room, separated by a curtain, is the bedroom of parents. It is also used for the storage of clothes and food (and sometimes for the storage of given treated nets instead of their actual use on bed and other “sleeping unit” of the house.)
Houses were labeled (with a number on the door) and mapped with GPS localization.
Several changes were observed in some villages, such as Caala, where people destroyed their “old” house to build a new one, elsewhere within the village, but keeping the door, and its number, which is used to locate the new place of the family when they were randomly selected for parasitological surveys.
The protocol was based upon the one implemented in Côte d’Ivoire (28) where entomological then, two weeks later, parasitological surveys were conducted in order to evaluate the efficacy of lambdacyhalothrin-treated nets in areas where the main vector, An. gambiae, had a kdr-based pyrethroid resistance.
2-2. Census
Before the trial, a comprehensive census was done in each village by the village health worker, who documented the composition of the family of each house.
The demographic and geographic situation of each village is indicated in Table 1.
Village | Number of inhabitants | Number of houses | Number of sleeping units* |
Caala | 808 | 239 | 469 |
Cahata | 517 | 154 | 442 |
Capango | 177 | 60 | 89 |
Canjala | 873 | 401 | 422 |
Chisséquélé | 418 | 181 | 201 |
Barragem | 620 | 134 | 168 |
Libata | 1,344 | 258 | 513 |
Candiero | 654 | 190 | 380 |
Total | 5,411 | 1,617 | 2,684 |
Table 1. Demographic information on the eight villages involved at the beginning of the project in February 2007. (* a sleeping unit was defined as any item used for sleeping, including permanent beds, temporary mats, cardboard, loincloths, and other items unfolded at night to sleep.)
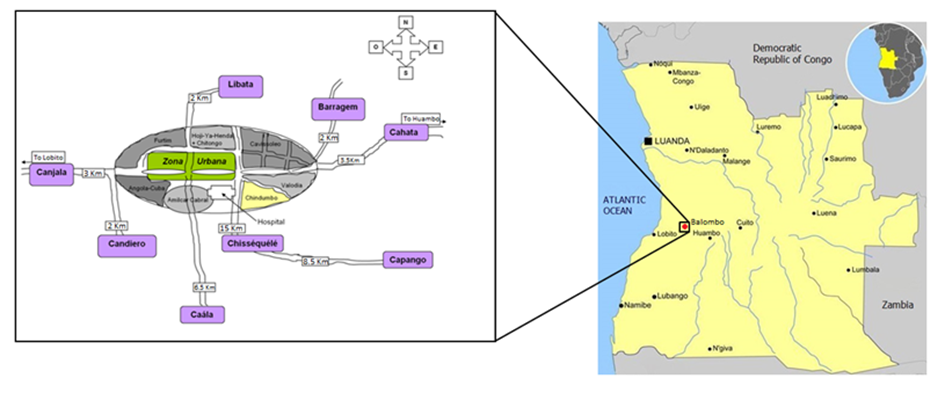
Map of the eight villages around Balombo town (from Brosseau et al., 2012).
The program included initially 5,411 people in 1,617 houses (#3.3 inhabitants per house).
2-3. Tools used for vector control
Four tools were used for vector control:
- Long-lasting insecticide-treated nets (LLIN), model “PermaNet® 2.0”, treated at 55 mg a.i. deltamethrin (δ)/m2; with a surface area of 13 m2, the total amount of insecticide was 0.715 gr a.i. deltamethrin/LLIN.
- Insecticide-treated plastic sheeting (ITPS), model “ZeroVector”® treated at 170 mg a.i. δ/m2 and presented in rolls.
- Insecticide-treated plastic sheeting, model “ZeroFly®”, treated at 360 mg a.i. δ/m2; with a size of 19.11 m2, the total amount of insecticide was 6.88 gr a.i. δ/ ZeroFly®.
- Sachets of lambdacyhalothrin (λ) “Icon® WP”, 6.25 gr a.i. λ/sachet; for indoor residual spraying, targeting 25 mg a.i./m2 of sprayed surface, two rounds, followed by installation of ITPS.
2-4. Vector control operations (VCOp)
LLINs were distributed at the beginning of the program, in two villages (Caala and Cahata) (in February 2007 targeting “at least one net per house” then in February and December 2008 targeting “one net per sleeping unit” to get full coverage). The other six villages remained without vector control for two years (2007-2008) and were considered as “control villages” during this period which was called “before VC”. The three following years (2009-2010-2011) were called “after VC”.
In Caala, a total of 636 LLINs were distributed for 239 houses and 469 sleeping units, while in Cahata, 530 LLINs were distributed for 154 houses and 442 sleeping units. These distributions were considered as having achieved the full coverage of the population.
The average amount of insecticide per house, differed greatly according to the vector control method implemented, from 1 g a.i. deltamethrin/house with LLIN (and almost the same with λIRS), to 10 gr a.i. δ/ house with the combination of methods, and even 13.1 gr a.i./house with ZeroFly®; ITPS alone (Annex 1).
2-5. Entomological protocol
2-5-1. Mosquito collections and biological analysis
Entomological surveys were performed every two months during five years: the two years (2007-2008) “before vector control” and the three years (2009-2010-2011) “after vector control.” Entomological evaluation was based on classical CDC miniature light traps (CDC-LTs), widely used for sampling Anopheles populations. (29, 30, 31, 32, 33)
For each session, 10 traps were installed inside houses that had, initially, been randomly selected. These same 10 houses were used for each subsequent entomological survey. Traps were switched on at 6 pm and switched off at 6 am the following day. Mosquitoes were identified, at the genus level, and Anopheles species determined with classical keys (34) on the spot, then isolated in plastic tubes, and kept in a dry atmosphere until their identification at the species level (An. gambiae complex) and classical circumsporozoite ELISA analysis (35, 36) . Molecular identification of members of the An. gambiae complex was done following the RFLP-PCR assay (37) which allows, with one amplification and a digestion with HhaI restriction enzyme, the differentiation between An. gambiae and An. coluzzii, as well as the other members of the complex.
2-5-2. Entomological analyzes
Following the method of Sriwichai et al. (33) absolute vector numbers caught by the traps were converted into “capture rates,” i.e. the number of specimens per trap. For each year, and each village, the total number of An. gambiae and An. funestus, the main vectors (MV), collected was divided by the total number of CDC-LTs installed to calculate the “number of Anopheles vectors per trap”. This number was considered to be a reliable indicator of the density per house, and a figure that would evolve with the implementation of the vector control methods.
Combining this data with infectivity rates (ELISA positive) gave some proxy of the “indoor risk of inoculation,” or “entomological inoculation rate” (EIR), and its evolution depending on the vector control methods.
The entomological inoculation rate (h) was calculated with the classical Ross’ formula, h = ma.s (with ma = number of bites received in one day by one human being, estimated with CDC-LTs in the Balombo trial for operational and ethical reasons; and s = infectivity rate estimated by ELISA tests).
Statistical analyses of Anopheles samples collected by traps were done using the nonparametric Mann-Whitney test; graphs were prepared using GraphPad software.
2-6. Parasitological protocol
The evaluation of parasitological impact of vector control was based upon cross-sectional surveys (“CSS”) regularly performed every two months, two weeks after entomological surveys.
Each parasitological survey was conducted on a randomized sample of symptomless ≤15 year-old children, chosen after mapping and enumerating each house (with the number of the door), localized with Global Positioning System (GPS) in previous demographic surveys. Classical thick blood films (TBF) were done in the field, and microscopically examined in the medical department of the Sonamet® Company in Lobito, which had implemented a “Malaria Control Program” (“MCP”). The Balombo project was a component of this MCP. 10% of the slides were double-checked in OCEAC Yaoundé laboratory.
Three indicators were considered: Plasmodium prevalence (also called “plasmodic index” “PI”), parasite load (also called “parasitaemia”, “PL”), and gametocyte index (“GI”). Their evolution was analyzed according to villages and vector control methods, considering the same two periods: before (two years) and after (three years) vector control implementation as was done for entomological evaluation.
Statistical analysis of parasite counts in each thick blood film was done with the non-parametric Mann-Whitney test; graphs were prepared with GraphPad software. Percentages were compared with the classical Chi square test.
3.Results
3-1. Entomological results
3-1-1.Anopheles species caught
From 2007 to 2011, 202 catching sessions with CDC Light Traps were conducted in the eight villages, representing a total of 1,880 trap-nights, which caught 1,153 Anopheles specimens, belonging to 11 taxa including 9 species and 1 species complex, Gambiae (Table 2).
Village/ Species | Caala | Cahata | Capango | Canjala | Chiss. | Barr. | Candi. | Libata | Total |
An. gambiae s.l. | 15 | 11 | 8 | 1 | 8 | 1 | 8 | 3 | 55 |
An. funestus | 71 | 74 | 119 | 60 | 32 | 46 | 56 | 55 | 513 |
An. marshallii | 37 | 30 | 79 | 22 | 18 | 11 | 26 | 20 | 243 |
An. ziemanni | 19 | 4 | 28 | 3 | 6 | 3 | 4 | 8 | 75 |
An. maculipalpis | 43 | 24 | 72 | 6 | 27 | 7 | 19 | 8 | 206 |
An. hancocki | 0 | 0 | 5 | 0 | 0 | 1 | 1 | 0 | 7 |
An. nili | 7 | 0 | 1 | 2 | 1 | 0 | 0 | 0 | 11 |
An. pharoensis | 3 | 2 | 14 | 0 | 2 | 0 | 1 | 0 | 22 |
An. coustani | 0 | 1 | 4 | 0 | 3 | 0 | 2 | 0 | 10 |
An. tenebrosus | 2 | 1 | 6 | 0 | 0 | 0 | 1 | 0 | 10 |
Total* | 197 | 147 | 336 | 94 | 97 | 69 | 118 | 94 | 1,152 |
Table 2. Anopheline species caught by CDC Light Traps inside villagers' houses in the eight surveyed villages, from 2007 to 2011. (*+ 1 An. rufipes) (Chiss. = Chisséquélé; Barr. = Barragem; Candi. = Candiero).
The main Anopheles were An. funestus (44.7%), abundant in every village, followed by An. marshallii (21.0%), An. maculipalpis (17.8%), An. ziemanni (6.5%), and An. gambiae s.l. (4.8%). The other five species, including An. pharoensis (1.9%), An. nili (1%), An. coustani, An. tenebrosus (0.9%), and An. hancocki (0.6%) were scarce. Therefore, only An. gambiae and An. funestus were considered as the main vectors (“MV”) for further analysis. An. marshallii is known as a mainly zoophilic species and secondary vector.
The molecular analysis of a subsample of 45 An. gambiae s.l. specimens, out of the 55 caught, showed the preponderance of An. gambiae (82.2%), with only 3 specimens of An. coluzzii and 5 An. arabiensis.
3-1-2. Densities of MV/T according to villages
The distributions of the number of main vectors per trap, during the five years, in each village, are presented Graph. 1.
Densities were similar between paired villages (Graph. 1)
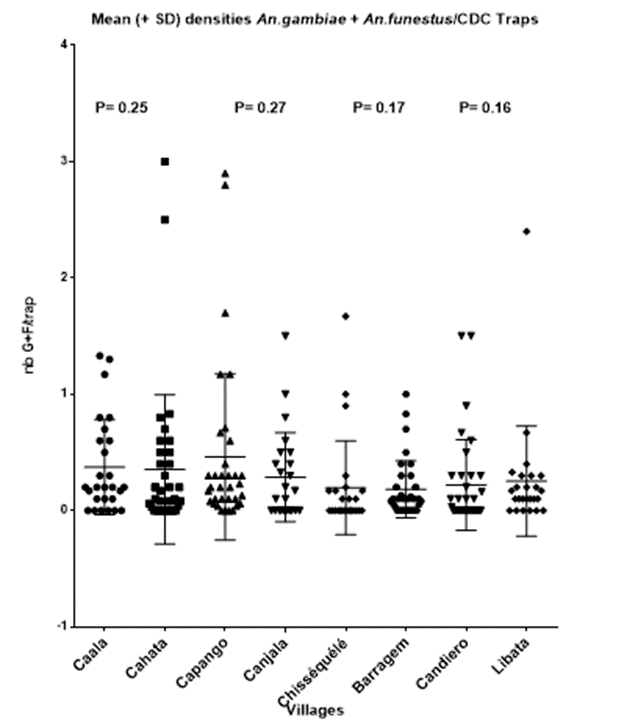
Graph. 1: Distribution of the number of main vectors per trap in each village during the five years of the trial.
Densities were almost similar between villages, excepted in Chisséquélé where densities were often lower than in other villages. (Table 3).
villages | Caala | Cahata | Capango | Canjala | Barragem | Chisséquélé | Candiero | Libata |
Caala |
| 0.9822 | 0.5425 | 0.2369 | 0.1965 | 0.0088 | 0.3056 | 0.1881 |
Cahata |
| 0.6798 | 0.2432 | 0.2167 | 0.0139 | 0.3026 | 0.1634 | |
Capango |
| 0.1226 | 0.0838 | 0.0020 | 0.1141 | 0.0752 | ||
Canjala |
| 0.9644 | 0.2236 | 0.9481 | 0.9490 | |||
Barragem |
| 0.1321 | 0.9961 | 0/9967 | ||||
Chisséquélé |
| 0/1937 | 0.0641 | |||||
Candiero |
| 0.8786 | ||||||
Libata |
|
3-1-3. Evolution of densities of main malaria vectors (MV) according to village
The yearly evolution of the capture rate of the main vectors, An. gambiae s.l. and An. funestus, in each village of the study, is presented Table 3.
Villlage/Year | Y 2007 | Y 2008 | Y 2009 | Y 2010 | Y 2011 |
Caala | 0.56 | 0.42 | 0.35 | 0.12 | 0.47 |
Cahata | 1.29 | 0.43 | 0.18 | 0.12 | 0.30 |
Capango | 1 | 1.1 | 0.15 | 0.45 | 0.23 |
Canjala | 0.5 | 0.38 | 0.07 | 0.1 | 0.53 |
Chisséquélé | 0.54 | 0.40 | 0.05 | 0 | 0 |
Barragem | 0.58 | 0.25 | 0.25 | 0.02 | 0.07 |
Libata | 0.33 | 0.53 | 0.15 | 0.08 | 0.13 |
Candiero | 0.67 | 0.47 | 0.07 | 0.12 | 0.30 |
Table 3. Evolution of density/trap of main vectors, An. funestus and An. gambiae, according to year (Y) and village.
Densities were very low (less than 1 MV/trap/night) with a great diversity of situations according to years and villages. (Graph. 2)
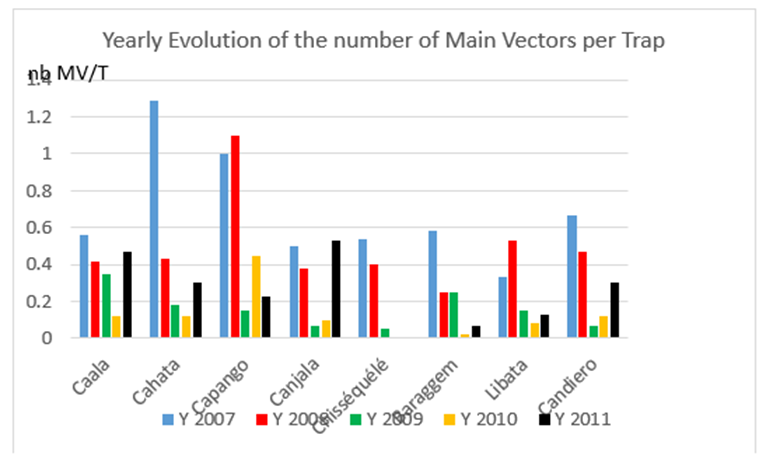
Graph 2: Yearly evolution of the number of main vectors per trap, in each village, over the first five years. (MV/T = number of main vectors per CDC Light Trap).
In villages with LLIN: the impact of treated nets was quite clear in Cahata but not in Caala; a slight increase in densities was noticed in 2011, i.e. three years after complete coverage with LLINs in both villages; in Caala the density in 2011 was almost the same as in 2007.
In control villages:
- Before vector control: during these two years, densities were similar in Capango and in Canjala, decreased in Chisséquélé and Barragem, and increased in Libata.
- After vector control: in 2009, the year following the complete vector control operation, a striking drop occurred almost everywhere, except in Barragem, where the drop was observed the following year.
- The second year after vector control a drop was observed in almost all villages, except Capango (in which association LLIN and ZF was implemented), where the density increased.
- A general increase occurred in 2011, i.e. three years after vector control implementation.
- A still very low number of main vectors per trap over two years (2010-2011) was observed only in the two villages (Barragem and Chisséquélé) with durable lining only.
3-1-4. Evolution of densities of main malaria vectors according to the method of vector control
Each method induced a striking, and significant, reduction of the densities in each village, except in Caala (P value=0.48) and Candiero (P value= 0.08). (Graph. 3)
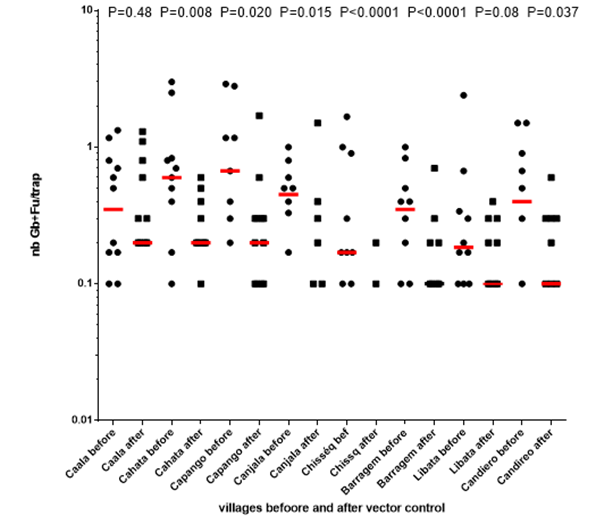
Graph. 3. Evolution of the number of main vectors per trap in each village before vs. after implementation of each vector control method.
The distribution of main vectors per trap, between the two years before, and the three years after vector control, decreased significantly with each method. (Graph. 4)
Graph.4. Evolution of the number of main vectors per trap before vs. after implementation of each vector control method.
The average decrease after vector control was slightly different according to the method of vector control, with an average of 71%, from 61% with LLIN alone, to 83% with durable lining alone. (Table 4)
Methods of VC | Years 2007-2008 (= before) | Years 2009-2010-2011 (= after) | Difference |
LLINs | 0.671 | 0.263 | -60.8% |
LLIN+ZF | 0.732 | 0.230 | -68.6% |
DL ZV | 0.421 | 0.070 | -83.4% |
IRS then DL | 0.501 | 0.127 | -74.7% |
Total | 0.583 | 0.173 | -70.4% |
Table 4. Evolution of the average of An. gambiae and An. funestus caught by CDC Light Traps in paired villages, according to the method of vector control implemented, before (years 2007-2008) and after vector control implementation.
3-1-5. Infectivity of main vectors, and its evolution, according to the method of vector control implemented.
A total of 1,133 Anopheles were analyzed with ELISA and 28 were positive, i.e. a general positivity index of 2.47%, with 7.27% (n=55) for An. gambiae; 3.60% (n=500) for An. funestus and 2.06% for An. marshallii (n=243). (Table 5a)
Species | ELISA + | n | s (%) |
An. gambiae | 4 | 55 | 7.27 |
An. funestus | 18 | 500 | 3.60 |
An. marshallii | 5 | 243 | 2.06 |
An. ziemanni | 0 | 75 | 0 |
An. maculipalpis | 0 | 206 | 0 |
An. coustani | 0 | 7 | 0 |
An. nili | 0 | 11 | 0 |
An. pharoensis | 1 | 22 | 4.54* |
An. hancocki | 0 | 10 | 0 |
An. tenebrosus | 0 | 1 | 0 |
Table 5a. Infectivity of the different Anopheles species for the five years of the study. (n = number of specimens analyzed; ELISA+ = number of specimens positive in ELISA tests; s= sporozoitic index; * small size of the sample tested).
The infectivity of the two main vectors gathered, An. gambiae and An. funestus, was 3.96% (n=555), five specimens of An. marshallii and one of An. pharoensis were found ELISA positive.
The overall infectivity of An. gambiae and An. funestus gathered remained statistically similar: 4.53% (n=375) before and 2.78% (n=180) after VC (X2=0.98; p=0.32; OR=0.60 [0.22-1.66]), (Table 5b), although the 48.6% reduction is noteworthy.
Situation |
| Before |
|
| After |
|
| Total MV |
|
species | n | E+ | % | n | E+ | % | n | E+ | % |
An. gambiae | 31 | 4 | 13.02 | 24 | 0 | 0 | 4 | 55 | 7.27 |
An. funestus | 344 | 13 | 3.78 | 156 | 5 | 3.21 | 18 | 500 | 3.60 |
Total | 375 | 17 | 4.53 | 180 | 5 | 2.78 | 22 | 555 | 3.96 |
Table 5b. Evolution of infectivity rate of main vectors before vs. after implementation of vector control (MV= main vectors).
No particular change in infectivity was induced by any of the vector control methods implemented. (Table 5c)
Method |
| Before |
|
| After |
|
| E+ | n | % | E+ | n | % |
LLIN | 3 | 106 | 2.83 | 2 | 65 | 3.08 |
LLIN+ZF | 5 | 119 | 4.20 | 0 | 56 | -- |
DL | 3 | 66 | 4.54 | 1 | 21 | 4.76 |
IRS | 6 | 84 | 7.14 | 2 | 38 | 5.26 |
Total | 17 | 375 | 4.53 | 5 | 180 | 2.78 |
Table 5c. Evolution of infectivity rate of main vectors before vs. after implementation of each vector control method. (LLIN = long-lasting insecticide-treated nets; ZF = insecticide-treated plastic sheeting model ZeroFly®; DL = durable lining insecticide-treated plastic sheeting model ZeroVector®; IRS = indoor residual spraying; E+ = specimens positive with ELISA test).
3-1-6. Evolution of the “Inside House Entomological Inoculation Rate” according to vector control
By combining the evolution of the “average density/trap” (Table 4) and the infectivity (Table 5c), it is possible to estimate some proxy of the evolution of the risk of receiving one infected bite in one day, or one month (Table 6), according to the method of vector control implemented (Graph.5). The entomological inoculation rate (EIR) decreased by #60% with LLIN and, similarly, by 80% with other methods, with an average of 82?ter implementation of vector control. A level similar to the one usually reported by other vector control trials with LLINs.
Method | Before/after | ma | s | h | diff |
LLIN alone | Before | 0.671 | 0.0283 | 0.569 |
|
| After | 0.263 | 0.0308 | 0.243 | - 57.3% |
LLIN+ZF | Before | 0.732 | 0.0420 | 0.922 |
|
| After | 0.230 | 0.0278* | 0.192 | -79.2% |
DL ZV | Before | 0.421 | 0.0455 | 0.574 |
|
| After | 0.070 | 0.0476 | 0.099 | - 82.7% |
IRS then DL | Before | 0.501 | 0.0714 | 1.073 |
|
| After | 0.127 | 0.0526 | 0.200 | - 81.3% |
total | Before | 0.583 | 0.0453 | 0.792 |
|
| After | 0.173 | 0.0278 | 0.144 | -81.8% |
Table 6. Evolution of the monthly entomological inoculation rate (h), before and after vector control. (* assuming an infectivity similar to the average).
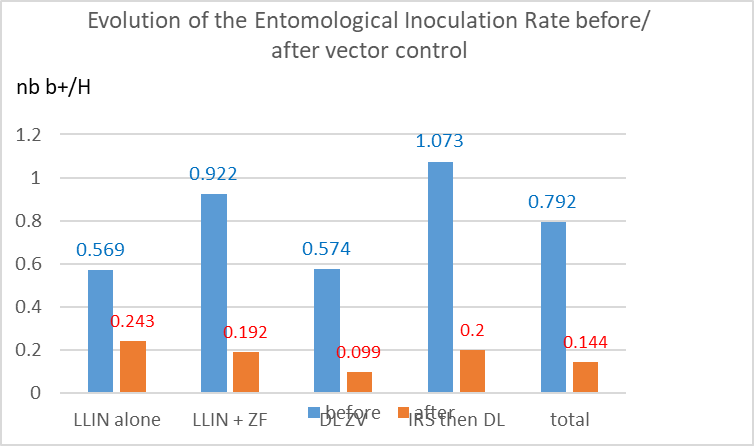
Graph 5: Evolution of the monthly entomological inoculation rate according to the method of vector control. (nb b+/H= number of infective bite/human being)
3-2. Parasitological results
3-2-1. Overall plasmodic index according to village
A total of 190 surveys were performed regularly, from the year 2007 to the year 2011; 20,188 thick-blood films were prepared and microscopically examined. P. falciparum was largely predominant. Very few cases of P.malariae were diagnosed (22 alone and 44 in association with P. falciparum). Therefore, analysis of data considered all plasmodial infections together.
In the sample of symptomless children ≤15 years old, trophozoites of Plasmodium were noticed in 5,330 (n= 20,188) thick-blood films done, i.e. an overall plasmodic index of 26.4% (Table 9), and gametocytes were noticed in 553 films, i.e. an overall gametocyte index of 2.73%.
3-2-2. Yearly evolution of plasmodic index according to village
Data describing the results of microscopic examination of thick blood films for every village and every year are presented in Table 7.
PI /CSS | Caala 25 css | Cahata 25 css | Capango 24 css | Canjala 24 css | Chiss. 23 css | Barr. 23 css | Cand. 23 css | Libata 23 css | Total 190 css | |
| PF+ | 400 | 408 | 119 | 379 | 121 | 215 | 180 | 249 | 2,071 |
Y 2007 | n | 802 | 739 | 274 | 661 | 357 | 428 | 439 | 488 | 4,188 |
| % | 49.9% | 55.2% | 43.4% | 57.3% | 33.9% | 50.2% | 41.0% | 51.0% | 49.5% |
| PF+ | 322 | 242 | 110 | 352 | 183 | 213 | 208 | 378 | 2,008 |
Y 2008 | n | 888 | 675 | 376 | 802 | 646 | 622 | 749 | 845 | 5,603 |
| % | 36.3% | 35.9% | 29.3% | 43.9% | 28.3% | 34.2% | 27.8% | 44.7% | 35.8% |
| PF+ | 145 | 108 | 55 | 116 | 110 | 75 | 94 | 122 | 825 |
Y 2009 | n | 724 | 534 | 466 | 560 | 603 | 536 | 656 | 617 | 4,696 |
| % | 20.0% | 20.2% | 11.8% | 20.7% | 18.2% | 14.0% | 14.3% | 19.8% | 17.6% |
| PF+ | 97 | 45 | 21 | 66 | 29 | 30 | 29 | 50 | 367 |
Y 2010 | n | 640 | 580 | 466 | 613 | 562 | 585 | 629 | 617 | 4,692 |
| % | 15.2% | 7.8% | 4.5% | 10.8% | 5.2% | 5.1% | 4.6% | 8.1% | 7.8% |
| PF+ | 19 | 6 | 5 | 7 | 5 | 7 | 5 | 5 | 59 |
Y 2011 | n | 134 | 125 | 128 | 121 | 113 | 136 | 131 | 121 | 1,009 |
| % | 14.2% | 4.8% | 3.9% | 5.8% | 4.4% | 5.1% | 3.8% | 4.1% | 5.8% |
| PF+ | 983 | 809 | 310 | 920 | 448 | 540 | 516 | 804 | 5,330 |
Total | n | 3,188 | 2,653 | 1,710 | 2,757 | 2,281 | 2,307 | 2,604 | 2,688 | 20,188 |
| % | 30.8% | 30.5% | 18.1% | 33.4% | 19.6% | 23.4% | 19.8% | 29.9% | 26.4% |
Table 7. Overall plasmodic index noticed in symptomless ≤ 15 year-old children, every year, in the eight villages (PF+ = number of positive thick films; n= number of thick films made; css= number of cross-sectional surveys done) (Barr. = Barragem; Chiss. = Chisséquélé; Cand. = Candiero).
A decrease in plasmodic index was observed, each year, in each village (Graph. 6), with an average of 27.9% from Y 2007 to 2008 then, successively, -50.8% the first year after vector control; -55.6% the second year after vector control and -25.6% the third year.
A clear impact was observed during two years post vector control and the evolution the third year was similar to the natural variations observed before vector control.
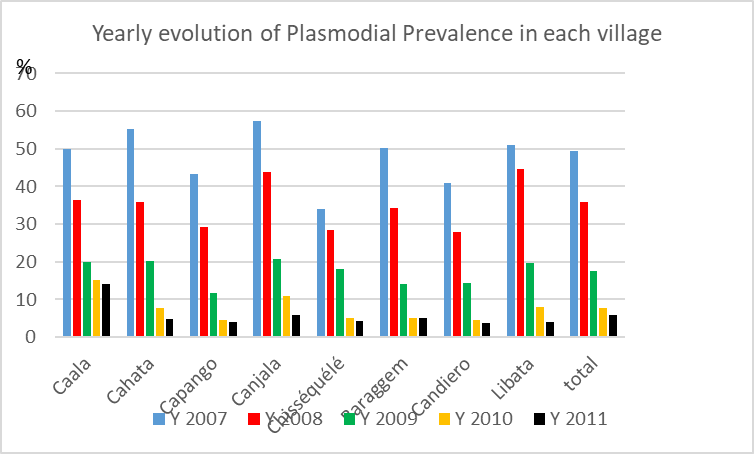
Graph. 6. Yearly evolution of plasmodial prevalence in each village.
3-2-3. Yearly evolution of plasmodic index according to the vector control method implemented
Data gathering the evolution of the plasmodic index each year, according to the vector control method implemented, are presented Table 8.
Year/VC |
| LLIN | LLIN + ZF | DL ZV | IRS then DL |
| PF+ | 808 | 498 | 336 | 429 |
Year 2007 | n | 1,541 | 935 | 785 | 927 |
| % | 52.4% | 53.3% | 42.8% | 46.3% |
| PF+ | 564 | 462 | 396 | 586 |
Year 2008 | n | 1,563 | 1,178 | 1,268 | 1,594 |
| % | 36.1% | 39.2% | 31.2% | 36.8% |
| PF+ | 253 | 171 | 185 | 216 |
Year 2009 | n | 1,258 | 1,026 | 1,139 | 1,273 |
| % | 20.1% | 16.7% | 16.2% | 17.0% |
| PF+ | 142 | 87 | 59 | 79 |
Year 2010 | n | 1,220 | 1,079 | 1,147 | 1,246 |
| % | 11.6% | 8.1% | 5.1% | 6.3% |
| PF+ | 25 | 12 | 12 | 10 |
Year 2011 | n | 259 | 249 | 249 | 252 |
| % | 9.7% | 4.8% | 4.8% | 4.0% |
| PF+ | 1,792 | 1,230 | 988 | 1,320 |
Total | n | 5,841 | 4,467 | 4,588 | 5,292 |
| % | 30.7% | 27.5% | 21.2% | 24.9% |
Table 8. Yearly evolution of plasmodial prevalence according to the vector control method implemented. (LLIN = long-lasting insecticide-treated nets alone; LLIN + ZF = association long-lasting insecticide-treated nets + durable lining model ZeroFly®; DL ZV= durable lining model ZeroVector® alone; IRS= indoor residual spraying, followed by durable lining DL) (PF+ = number of positive thick films; n= number of thick films made).
Trends in the evolution of the yearly plasmodial prevalence, according to the vector control method implemented, appeared remarkably similar (Graph. 7), with a clear drop in 2009 and in 2010, and then plateaued at a very low level (# 5%).
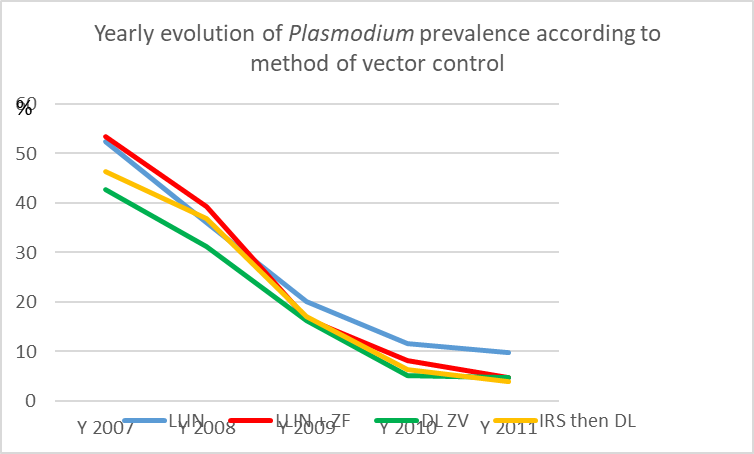
Graph. 7. Trends in the evolution of the yearly plasmodic index according to the vector control method implemented. (LLIN= long-lasting insecticide-treated nets; LLIN+ZF= treated nets + durable lining model ZeroFly®; DL ZV= durable lining model ZeroVector®; IRS then DL= indoor residual spraying then durable lining).
Before vector control, during the first two years of the project (2007-2008), the plasmodic index decreased significantly, by 31.1% in the two villages furnished with LLIN (χ2=84.1; OR=0.51 [0.44-0.59]) and by 25%; from 47.7% (n=2,647) to 35.7% (n=4,040) (χ2=95.1; OR=0.61 [0.55-0.67]) in the six control villages (Table 9).
Method VC/Years | Y 2007 to Y 2008 | Y 2008 to Y 2009 | Y 2009 to Y 2010 | Y 2010 to Y 2011 |
LLIN | - 31.1% | - 41.6% | - 45.0% | - 16.4% |
LLIN + ZF | - 26.5% | - 57.4% | - 51.5% | - 40.7% |
DL ZV | -27.1% | - 48.1% | - 68.5% | - 5.9% |
IRS then DL | -20.5% | - 53.8% | - 62.9% | - 36.5% |
Total | -27.7% | -50.8% | -55.7% | -26.5% |
Table 9. Relative reduction of plasmodic index, from year to year, according to the vector control implemented.
After vector control, the relative reduction of plasmodic index, from year to year was striking (-50%) for each method of vector control during two years. (Graph. 8).
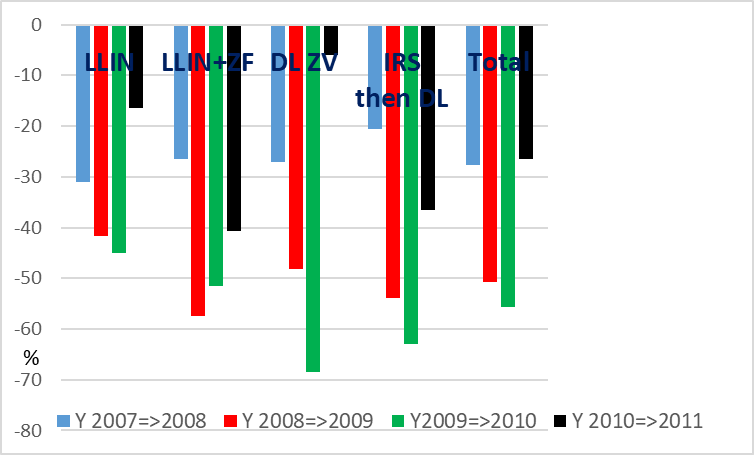
Graph. 8. Yearly reduction of the plasmodic index during the five years of the trial.
The third year the reduction of plasmodic index was maintained in villages with the association LIN + ZeroFly and the combination of IRS then DL while it was fading in villages with LLIN alone or DL ZeroVector® alone.
For the eight villages considered together, the quick decrease in plasmodic index over the years was important, with a relative 50.8?crease the first year after vector control, and then another 55.7?crease the second year. However the efficacy was reduced the third year with a relative 25.6% diminution in 2011, similar to the 27.7?crease observed the first two years without any intervention.
3-2-4. Evolution of plasmodic index according to the period: before vs after implementation of vector control
Two main periods were considered: “before vector control” (spanning the two years 2007-2008) to account for natural variations from year to year, and “after vector control”, spanning the three years 2009-2010-2011.
- Evolution of plasmodic index according to village
Evolution of plasmodic index in each village is reported in Table 10. There appeared to be a significant decrease in each one, with some variation according to village, from 60% (Caala) to 80% (Capango, Barragem), and a remarkable similarity in the two villages with IRS then durable lining, with a 72% reduction.
Village/period | Before | After | Diff | OR |
Caala | 42.7% (n=1,690) | 17.4% (n=1,498) | -59.2% | 0.28 [0.24-0.33] |
Cahata | 45.9% (n=1,414) | 12.8% (n=1,239) | -72.1% | 0.17 [0.14-0.21] |
Capango | 35.2% (n=650) | 7.6% (n=1,060) | -78.4% | 0.15 [0.11- 0.20] |
Canjala | 49.9% (n=1,463) | 14.6% (n=1,294) | -70.7% | 0.17 [0.14- 0.21] |
Chisséquélé | 30.3% (n=1,003) | 11.3% (n=1,278) | -62.7% | 0.29 [0.23- 0.36] |
Barragem | 40.8% (n=1,050) | 8.9% (n= 1,257) | -78.2% | 0.14 [0.11- 0.18] |
Candiero | 32.7% (n= 1,188) | 9.0% (n= 1,416) | -72.4% | 0.20 [0.16- 0.25] |
Libata | 47.0% (n= 1,333) | 13.1% (n= 1,355) | -72.1% | 0.17 [0.14- 0.20] |
Total | 41.7% (n= 9,791) | 11.9% (n= 10,397) | -71.5% | 0.19 [0.18- 0.21] |
Table 10. Overall variations of plasmodic index according to village and situation “before”/”after” vector control.
The observed overall reduction of plasmodic index (PI) for the eight villages was 71% for the three years after vector control (PI=11.9%; n=10,397), compared to the two years before (PI=41.7%; n=9,791).
- Evolution of plasmodic index according to method of vector control
Each method of vector control reduced significantly the plasmodic index. (Table 11)
Method VC | Before | After | Difference | OR |
LLIN | 44.2% | 15.3% | -65.4% | 0.23 |
| (n=3,104) | (n=2,737) |
| [0.20-0.26] |
LLIN + ZF | 45.4% | 11.5% | -74.7% | 0.11 |
| (n=2,113) | (n=2,354) |
| [0.09-0.12] |
DL ZV | 35.7% | 10.1% | -71.7% | 0.20 |
| (n=2,053) | (n=2,535) |
| [0.17-0.24] |
IRS then DL | 40.3% | 11.0% | -72.7% | 0.18 |
| (n=2,521) | (n=2,771) |
| [0.16-0.21] |
Total | 41.7% | 11.9% | -71.5% | 0.19 |
| (n=9,791) | (n=10,397) |
| [0.18-0.21] |
Table 11. Evolution of plasmodic index before (years 2007-2008) and after (years 2009-2010-2011) implementation of each vector control method. (OR= Odds Ratio)
Comparing the Plasmodium prevalence before and after implementation of each method of vector control, showed a similar, and significant, reduction of some 70% (± 5%) of the prevalence of Plasmodium in the symptomless children examined.
3-2-5. Evolution of the parasite load
- Parasite load > 1,000 par./ml
The impact of each one of the four methods of vector control on parasitaemia higher than the classical threshold of 1,000 par./ml are reported Table 12.
Method VC | Situation | Total P+ | PL≥1,000 | % | Stat |
LLIN | Before | 1,372 | 365 | 26.6% | χ2=11.5 OR=0.63 [0.48-0.83] |
| After | 420 | 78 | 18.6% |
|
LLIN + ZF | Before | 960 | 281 | 29.3% | χ2=20.5 OR=0.44 [0.31-0.64] |
| After | 270 | 42 | 15.6% |
|
DL ZV | Before | 732 | 149 | 20.4% | χ2=30.9 OR=0.35 [0.24-0.51] |
| After | 256 | 34 | 13.3% |
|
IRS then DL | Before | 1,015 | 245 | 24.1% | χ2=30.9 OR=0.35 [0.24-0.51] |
| After | 305 | 34 | 11.1% |
|
Total | Before | 4,079 | 1,040 | 25.5% | χ2=59.2 OR=0.52 [0.43-0.67] |
| After | 1,251 | 188 | 15.0% |
|
Table 12. Evolution of parasite load (PL≥1,000 par./ml) according to the method of vector control implemented (P+= positive thick film).
Each vector control method implemented induced a significant reduction of parasitaemia ≥1,000 par./ml with an average of 41.2%, varying slightly according to the method: -30.1% with LLIN alone; -43.0% with the association LLIN + ZeroFly®; -34.8% with durable lining ZeroVector® alone; -53.9% with IRS followed by durable lining.
a)Parasitaemia
The dispersion of parasite load was very large, from 20 to more than 100,000 par./ml.
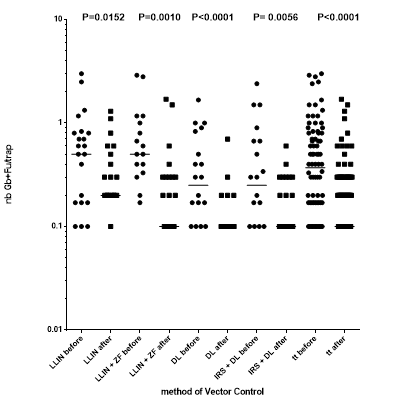
The statistical analysis of parasitaemia “before” vs. “after” showed that each vector control method significantly reduced the parasite load of symptomless children ≤15 years old. (Graph. 9).
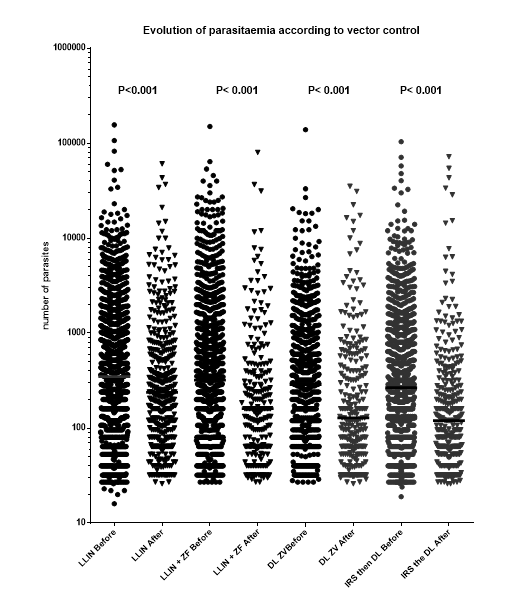
Graph 9: Evolution of the parasite load (before vs. after vector control) in symptomless children ≤ 15 years old according to the vector control method implemented (each point = a number of parasite per thick film). (LLIN= long-lasting insecticide-treated nets; LLIN+ZF= treated nets + durable lining model ZeroFly®; DL ZV= durable lining model ZeroVector®; IRS then DL = indoor residual spraying then durable lining)
3-2-6. Evolution of gametocyte index
Gametocytes were noticed in 553 of the 20,188 thick films made during the study, i.e. an overall gametocyte index of 2.74%.
There was a significant reduction of 66.3% (from 4.16% to 1.40%) (χ2=143; OR=0.33 [0.27-0.39]) after implementation of vector control which induced sharp, and significant, reductions, with each method implemented (Table 13a).
Method |
| Before |
|
| After |
| Diff. | Stat |
VC* | G+ | n | % | G+ | n | % |
|
|
LLIN | 133 | 3,104 | 4.28 | 55 | 2,737 | 2.01 | -53% | χ2=24.2 P<0> OR=0.46 [0.33-0.64] |
LLIN + ZF | 105 | 2,113 | 4.97 | 38 | 2,354 | 1.61 | -67.6% | χ2=40.4 P<0> OR=0.32 [0.21-0.47] |
DL ZV | 68 | 2,053 | 3.31 | 28 | 2,535 | 1.10 | -66.8% | χ2=26.9 P< 0> OR=0.33 [0.21-0.51] |
IRS then DL | 101 | 2,521 | 4.08 | 25 | 2,771 | 0.90 | -77.5% | χ2=54.7 P<0> OR=0.22 [0.14-0.34] |
Total | 407 | 9,791 | 4.16 | 146 | 10,397 | 1.40 | -66.3% | χ2=143 OR=0.33 [0.27-0.39] |
Table 13a. Evolution of gametocyte index according to the method of vector control implemented. (G+= thick films with gametocytes; n= number of thick films examined; VC*= vector control)
The decreases of the gametocyte index and plasmodic index were consistent (Table 13b), showing an overall reduction of some 70% of these parasitological indicators.
Villages | PI | GI |
Caala | -59.2% | -41.7% |
Cahata | -72.1% | -62.9% |
Total LLIN | -65.3% | -53% |
Capango | -78.3% | -70.4% |
Canjala | -69.6% | -62.8% |
Total LLIN + ZF | -74.2% | -67.6% |
Barragem | -63.2% | -44.8% |
Chisséquélé | -77.9% | -78.6% |
Total DL ZV | -71.7% | -66.8% |
Candiero | -70.2% | -78.8% |
Libata | -72.2% | -74.6% |
Total IRS then DL | -71.7% | -77.5% |
TOTAL | -70.7% | -66.3% |
Table 13b. Reduction of plasmodic index (PI) and gametocyte index (GI) according to villages and vector control method implemented.
The similarity of the impacts of vector control of both plasmodic and gametocyte index is noteworthy (Graph. 10)
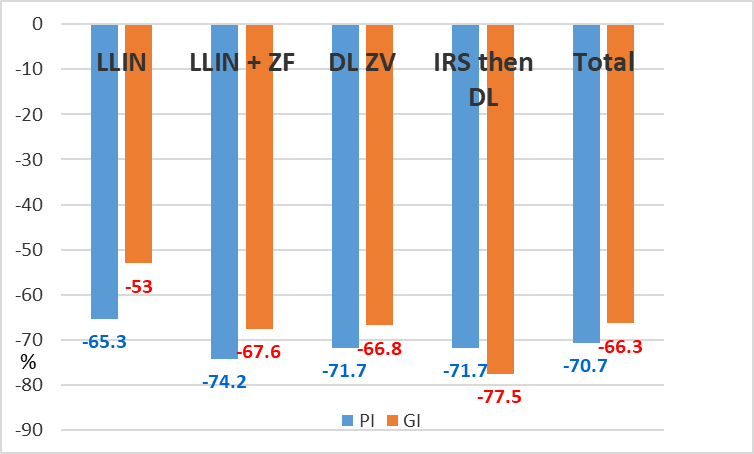
Graph. 10. Influence of each method of vector control on plasmodic index (PI) and gametocyte index (GI).
3-3. Synthesis: evolution of entomological and parasitological indicators
The evolution of entomological and parasitological data obtained by field surveys, done at the same time, during the first five years of the project, are remarkably consistent for each method of vector control (Table 14).
Method VC | Indicators | Before | After | Trends | diff. |
LLIN | ma | 0,671 | 0,263 | ↓ | -60,8% |
| h | 0,569 | 0,243 | ↓ | -57,3% |
| PI | 44,2% | 15,3% | ↓ | -65,4% |
| P≥1,000 | 26,6% | 18,6% | ↓ | -30,1% |
| GI | 4,28% | 2,01% | ↓ | -53,0% |
LLIN +ZF | ma | 0,732 | 0,230 | ↓ | -68,6% |
| h | 0,922 | 0,192 | ↓ | -79,2% |
| PI | 45,4% | 11,5% | ↓ | -74,7% |
| P≥1,000 | 29,3% | 15,6% | ↓ | -46,7% |
| GI | 4,97% | 1,61% | ↓ | -67,6% |
DL ZV | ma | 0,421 | 0,07 | ↓ | -83,4% |
| h | 0,574 | 0,099 | ↓ | -82,8% |
| PI | 35,7% | 10,1% | ↓ | -71,7% |
| P≥1,000 | 20,4% | 13,3% | ↓ | -34,8% |
| GI | 3,31% | 1,10% | ↓ | -66,8% |
IRS then DL | ma | 0,501 | 0,127 | ↓ | -74,7% |
| h | 1,073 | 0,200 | ↓ | -81,4% |
| PI | 40,3% | 11,0% | ↓ | -72,7% |
| P≥1,000 | 24,1% | 11,1% | ↓ | -53,9% |
| GI | 4,08% | 0,90% | ↓ | -77,9% |
total | ma | 0,583 | 0,173 | ↓ | -70,3% |
| h | 0,792 | 0,144 | ↓ | -81,6% |
| PI | 41,7% | 11,9% | ↓ | -71,5% |
| P≥1,000 | 25,5% | 15,0% | ↓ | -41,2% |
| GI | 4,16% | 1,40% | ↓ | -66,3% |
Table 14. Evolution of main entomological and parasitological indicators according to the vector control method implemented. (ma= number of main vectors/trap; h= entomological inoculation rate; PI= plasmodic index; P+++= parasitaemia > 1,000 par./ml.; GI= gametocyte index).
The impact on the reduction of inoculation rate (-80%) and plasmodial infections (-70%) were almost similar in villages with DL alone or the association LLIN + ZeroFly® or the sequence IRS (two rounds) then installation of durable lining.
Ranking
We did a ranking of entomological, parasitological and full impact of each method of vector control with number 1 for the main impact and 4 for the lower.
At entomological level; we considered two parameters: density (“ma”) and inoculation rate (“h”) (Table 15a). For density the ranking was 1 for Durable Lining alone, then 2 for the association in time of Durable lining following house spraying; 3 for the association LLIN + durable lining and 4 for LLIN alone. Considering the two indicators the ranking was DLZV>IRS then DL>LIN+ZF>LLIN.
method VC | ma | h | tt |
LLIN | 4 | 4 | 8 |
LLIN + ZF | 3 | 3 | 6 |
DL ZV | 1 | 1 | 2 |
IRS then DL | 2 | 2 | 4 |
Table 15a. Entomological ranking.
At parasitological level, we considered three parameters: plasmodic index (“PI”); parasite load (≥1,000 par./µl) and gametocyte index (“GI”) (Table 15b). The level of rank was different according to the indicators, but summing the ranks showed that the best was the association IRS then DL (4); almost similarly the association LLIN+ Durable lining (5), then durable lining alone (9) then LLIN alone (12).
methods VC | PI | P≥1,000 | GI | tt |
LLIN | 4 | 4 | 4 | 12 |
LLIN + ZF | 1 | 2 | 2 | 5 |
DL ZV | 3 | 3 | 3 | 9 |
IRS then DL | 2 | 1 | 1 | 4 |
Table 15b. Parasitological ranking.
Considering altogether, entomological and parasitological ranking, gave interesting information on the efficacy of each method of vector control according to the indicator selected (Table 15c).
method VC | ma | h | PI | P> | GI | total |
LLIN | 4 | 4 | 4 | 4 | 4 | 20 |
LLIN + ZF | 3 | 3 | 1 | 2 | 2 | 11 |
DL ZV | 1 | 1 | 3 | 3 | 3 | 11 |
IRS then DL | 2 | 2 | 2 | 1 | 1 | 8 |
Table 15c. Full ranking.
With such analysis the best method appeared the association IRS then DL (8) then, similarly, durable lining alone or in association with LLIN (11) (even with different entomological and parasitological ranks) then LLIN alone (20) (Graph. 11).
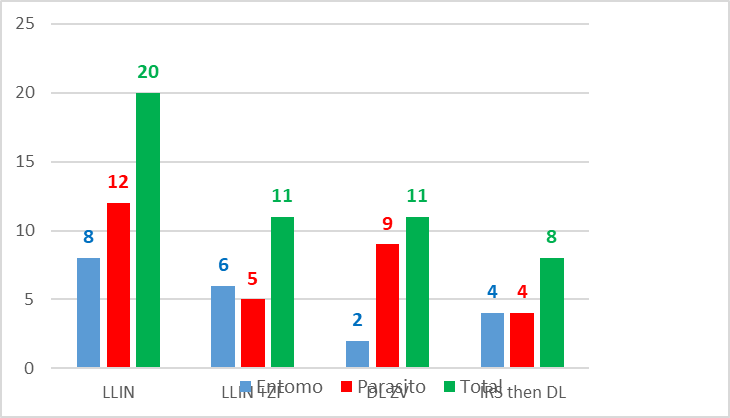
Graph. 11. Ranking of entomological and parasitological impacts of each method of vector control.
4.Discussion
Several studies have reported the issues of Plasmodium drug resistance in Angola (38) and the need for vector control in addition to the case management measures implemented by the National Malaria Control Program.
“In recent years, the Government of Angola, together with several international partners, has invested in several malaria prevention interventions targeting both disease vectors and the parasite. Implementation of intermittent preventive treatment of malaria in pregnancy (IPTp) was initiated in 2006 and, by 2019, roughly 10 million Angolans (30% of the population) had access to insecticide-treated bed nets (ITNs), including long-lasting insecticidal nets (LLINs), or indoor residual spraying (IRS). » (5)
Given the NMCP’s strategic goals, and increased commitment to advancing vector monitoring and control activities, interventions have focused on routine mass distribution of LLINs, particularly in areas where IRS was previously implemented, and IRS in selected municipalities. (39)
In Angola it was reported that ”following ITN distribution campaign (in 2017-2019) ITN coverage reached 98% in some provinces although one year later coverage estimates were down to 63% indicating that new ITNs/LLINS must be continuously supplied”. (5, 40)
In some villages around Balombo, it was observed that more than 50% of given nets had been torn and removed within two years (9, 41) and new tools other than nets, such as durable lining, could be proposed for malaria vector control.
For Messenger and Rowland (22) « there is an urgent need for the development of novel insecticide delivery mechanisms to sustain and consolidate gains in disease reduction and to transition towards malaria elimination and eradication. Insecticide-treated durable wall lining (ITWL) may represent a new paradigm for malaria control as a potential complementary or alternate longer-lasting intervention to IRS.”
New tools for vector control must meet three essential conditions: efficacy (short and long term to achieve the crucial sustainability); household and community acceptance with regular actual use and feasibility at large scale and long term basis.
In terms of efficacy, two points must be evaluated: entomological efficacy, such as deterrency, blood feeding inhibition, mortality against pyrethroid-susceptible and pyrethroid-resistant vectors with the final impact on the inoculation rate; and parasitological condition (Plasmodium species, prevalence, incidence, parasite load, and gametocyte) or clinical malaria burden (incidence rate of malaria crisis, severe and complicated malaria etc.)
At entomological level, several experimental huts trials, or demonstration houses, reported interesting entomological outcomes with ITPS. (15, 18, 42)
As a result of these trials, it was concluded that: a) “treated plastic sheeting (ITPS) as an interior wall liner, indicated that this intervention functions in a similar manner to IRS against host-seeking vectors entering indoors and alighting on walls either before or after blood-feeding, or if blocked from feeding by a mosquito net.”; b) “Only limited personal protection from biting was observed when ITPS was evaluated alone, suggesting disease control would instead be achieved through a ‘mass effect’ on vector density and longevity at the community-level.” (22) c) ITPS has a longer lasting effectivity (several years) than IRS (several months).
In India (Balaghat district), Zero vector® durable lining (ZVDL) was tested in six experimental villages and compared to IRS (with alphacypermethrin) “to assess its efficacy and persistence” against An. culicifacies (43). It was reported that the biting rate and the infectivity were reduced and “malaria declined sharply in experimental villages showing a slide positivity rate of 22.3% compared with control villages (36.4%).”
In Sierra-Leone, insecticide-treated plastic sheeting (ITPS) and untreated polyethylene sheeting (UPS) were randomly deployed in two camps, Largo and Tobanda, with two kinds of coverage inside the houses. Checking “the Plasmodium falciparum incidence rate in children up to 3 years of age who were cleared of parasites and monitored for 8 months” it was concluded that the “protective efficacy was 61% under fully lined ITPS and 15% under roof lined ITPS.“ (14)
In Liberia, it was observed that “Plasmodium falciparum prevalence on active clusters i.e. with LLIN alone or with durable wall lining after 12 months was 34.6% compared to 40.1% in control clusters (p= 0.052)” with the conclusion that “durable wall lining is a scalable and effective malaria control intervention in stable transmission area with pyrethroid-resistant vectors, where LLIN usage is difficult to achieve.” (44)
For Graham et al., (45) “mass coverage with deltamethrin-sprayed or impregnated tarpaulins or tents has strong potential for preventing malaria in a displaced population” even if “the tarpaulin shelter was a poor barrier to host-seeking mosquitoes and treatment with insecticide did not reduce the proportion of blood-feeding.”
It was considered that durable lining did not confer “individual” protection as treated mosquito nets do but rather they conferred “collective” protection such as house spraying.
As emphasized by Chaccour et al., (46)”most of the reduction in malaria prevalence seen in Africa since 2000 has been attributed to vector control interventions. Yet increases in the distribution and intensity of insecticide resistance and higher costs of newer insecticides pose a challenge to sustaining these gains. Thus, endemic countries face challenging decisions regarding the choice of vector control interventions."
The Balombo project was designed to assist the National Malaria Control Program in choosing appropriate, adapted tools for vector control, as additions to their other services, including case management with ACT and intermittent presumptive treatment for pregnant women.
The project was the first long-term village-scale malaria control trial planned and implemented in the region to compare both the entomological and the epidemiological efficacy of durable lining, alone or in combination with treated nets, or following house spraying, while considering long-lasting insecticide-treated nets as the “gold standard.” The project was carried out in complete natural conditions. The protocol followed the one implemented in Côte d’Ivoire to evaluate the efficacy of lambdacyhalothrin-treated-nets, with regular entomological, then parasitological surveys done every two months in areas with a high level of kdr-based pyrethroid-resistant An.gambiae population. (28).
The first requirement was to determine the main vectors in order to implement adapted methods of control. Actually it was observed, in the region, an external team conducting larval control by spreading Bacillus thuringiensis on every small pool of stagnant water, targeting An.gambiae only; although, in the Balombo area, the main vector was An. funestus with well-known completely different breeding sites (34) which remained untreated. Our surveys, and biological analyses, showed that, in fact, An.funestus and An. gambiae are the main vectors in the villages studied.
For Tavares et al. (5) “the information on individual Anopheles vector species in Angola is relatively scarce, possibly due to a loss in expertise and disruptions to studies and to control interventions throughout Angola’s war for independence and subsequent civil war, posing a major challenge to Angola’s NMCP.” “In the early 2000s, a few studies were performed on the spatial distribution of mosquito vectors, showing that main vectors in Angola included members of the Anopheles gambiae species complex (particularly An. gambiae sensu stricto, Anopheles arabiensis and Anopheles melas) and Anopheles funestus.”
During the first five years of the Balombo project, 202 catching sessions with CDC Light Traps, conducted in the eight villages around Balombo, and representing a total of 1,880 trap-nights, procured 1,153 Anopheles. Their analysis showed that the main vectors were An. funestus and An. gambiae, with low densities and an overall infectivity of 3.9%. These samples confirmed the predominance of An.funestus in Central regions and its role as main vector along with An. gambiae.
The molecular analysis of a subsample of 45 An. gambiae s.l. specimens, out of the 55 caught by the traps in Balombo villages, showed the preponderance of An. gambiae (82.2%), with only three specimens of An. coluzzii and five An. arabiensis. In their pyrethrum spray sampling Cuamba et al., (47) found mainly An. gambiae M form (= An. coluzzii) as resting inside houses but “the highest proportion of S-form (20%) was in samples from Huambo [a town close to Balombo], in the humid highlands.” The fact that An. gambiae was predominant in the humid area or season was also previously noticed in Lobito town (Angola). (48)
Recent field studies have demonstrated the existence of additional secondary malaria vectors such as Anopheles nili s.s, Anopheles squamosus, Anopheles ziemanni, Anopheles listeri, Anopheles concolor and Anopheles ruarinus in Angola’s central, and southeast regions, with the latter two species being quite rare. (49)
An. nili, An. ziemanni and other species were actually caught by CDC-LT in Balombo villages, but questionable were the five An.marshallii Elisa positive while this species is considered to be a secondary vector (50), known to be mainly exophilic, exophagic and zoophagic. (49, 51)
Larvae of An. listeri were collected in great numbers in stagnant salt water pools in Lobito town. (48)
In villagers ’houses in Balombo, wall lining, installed near sleeping areas, appeared to be as effective as classical LLIN PermaNet® 2.0 or indoor residual spraying in reducing by some 80% the number of main vectors (An. gambiae and An. funestus) caught by CDC Light Traps inside human houses, and by some 80% the entomological inoculation rate, while the infectivity of these vectors did not show a significant reduction.
During the trial, the four methods of vector control implemented induced a striking drop in the main densities of vectors in traps during the first two years, but, in the third year, an increase was observed. This increase could be related to the usual behaviour of villagers in withdrawing from intended use their dirty, torn mosquito nets (9) which were subsequently discarded in nearby fields or misused for a variety of purposes.
As well as the need to define the baseline entomological situation, there was a need to define the baseline parasitological situation, in order to avoid issues encountered in a recent house-spraying program in Angola. (8)
Before vector control implementation, several parasitological surveys were undertaken in the Balombo area (52, 53). Results of these surveys showed the high level of Plasmodium prevalence in symptomless children. The effect of partial and full coverage of long-lasting deltamethrin-treated-nets on Plasmodium falciparum parasitaemia was also studied in two villages around Balombo. (9)
In this study it was observed that more than 50% of given nets had been torn and removed within two years. Disuse, and misuse, of insecticide-treated nets are still matters of concern and discussion (54) with several socio-cultural components. (55). Reasons for not using a mosquito net when one is available were recently reported. (56)
For this reason it appeared worthwhile to evaluate the efficacy, and acceptability, of the recently developed durable lining tool for malaria vector control, especially in comparison with treated mosquito nets.
During the first five years, parasitological evaluation was performed in the field every two months, in complement to entomological evaluation, and based upon classical random parasitological cross-sectional surveys (CSS) focused on symptomless children ≤15 years old.
During the 190 surveys, a total of 20,188 thick blood films (TBF) were prepared. Their examination, by light microscope revealed plasmodial infections (mainly P. falciparum with very few P. malariae) in 5,330 TBF (i.e. plasmodic index=26.4%) and gametocytes in 553 (i.e. gametocyte index= 2.73%).
Analyses of the evolution of the three parasitological indicators (plasmodic index, parasite load, and gametocyte index), showed that the four methods of vector control had similar parasitological efficacy, inducing:
- a sharp, and statistically significant, reduction of Plasmodium prevalence, from 50?fore any intervention to less than 5% in three years after vector control implementation, i.e. a 90% reduction;
- a significant reduction of 70% of Plasmodium prevalence between the two years period before to the three years after vector control;
- a striking drop in Plasmodium prevalence the first two years after vector control then a stabilization at a very low level (5%);
- a significant reduction (40 ± 10%) of parasitaemia>1,000 par./ml; the highest reduction was obtained when two rounds of IRS were followed by durable lining installation, then with the combination of LLIN and ZeroFly® both of which seemed to have been resulted in higher reductions than LLIN alone or durable lining alone;
- a significant an interesting reduction of parasite load;
- a two-thirds reduction in the number of human gametocyte carriers, i.e. infectivity for vectors; combining LLIN and durable lining did not induce a spectacularly greater impact on gametocyte index in this trial.
The relatively greater effect on parasitaemia obtained with two rounds of lambdacyhalothrin IRS followed by the installation of deltamethrin-treated plastic sheeting is noteworthy.
This reduction of parasite load is crucial epidemiological information, considering the importance of parasitaemia in the diagnosis of malaria and in clinical illness. (57, 58, 59, 60)
These parasitological observations during the Balombo trial confirmed data reported with the use of tarpaulins in refugee camps in Africa, and from India, and the potential of durable lining as another, complementary tool for malaria control. (22)
On the other hand, the consistency of the entomological and parasitological data, gained by the way of field surveys performed simultaneously over five years, underlines the importance of such evaluation combining the two approaches for a better assessment of the effectiveness of vector control operations.
Actually, durable lining alone, or in combination with LLIN or following two rounds of indoor spraying, induced a similar reduction of the entomological inoculation rate, by 80%, and a similar reduction of plasmodial infections, by 70%, comparable to the 65% induced by LLIN.
In fact “overall, the trans-disciplinary cooperation among parasitologists and entomologists is crucial to ensure proper evaluation of the epidemiological impact triggered by novel mosquito vector control strategies.” (61)
From both entomological and parasitological analyses, the four methods of vector control implemented during the Balombo project appeared to have had almost similar impact, while in immunological analyses "the levels of anti-saliva IgG Ab were most reduced when LLIN and ITPS-ZF were used in combination, compared to the use of one vector control method alone, either ITPS-DL or IRS.” (27) But this immunological conclusion was reached after analysis and comparison of blood samples obtained the year before and the year after vector control, while entomological, and parasitological data, were obtained using long-term surveys, spanning several years.
Such different conclusions, from the same experiment, raises an issue about the main indicators selected to evaluate the efficacy of the vector control methods.
It is important to note that the density of vectors increased the third year while plasmodial infections stabilized at a very low level.
These observations suggest an extension of parasitological surveys to document whether this low level of plasmodic index, as a “plateau,” remained, and for what duration of time, or if any particular rise was observed at a certain interval after vector control (“rebound effect”). These issues are precisely the subjects of studies planned, and implemented, in phases two and three of the Balombo project, the conduct and results of which will be reported in the next article devoted to parasitological data.
Another key issue for the implementation of durable lining is their acceptance by communities over both the short and long terms and, therefore, the sustainability, and cost-effectiveness, of this approach.
Much work has been devoted to this issue of acceptability. (20, 23, 62, 63)
In the Balombo trial, wall lining was initially well-accepted as villagers themselves cut the plastic sheets to the right size for their room and pinned them to their walls, and hung various household items, such as kitchen utensils, pictures, calendars etc. But, after a while, it was observed that, in some homes, plastic sheeting had been removed then discarded, here and there, in nearby fields, in the same way that torn, dirty mosquito nets had been discarded.
Several cases of misuse of durable lining were observed; pieces of ZeroFly® were cut and used as clothesline, or to protect plants from goats or for local market stalls etc.
From focus group discussions, it became clear that villagers removed plastic sheeting because they thought that their presence increased the number of fleas (locally called “soyouyou”) in their houses.
In fact, the high dosage of deltamethrin in the durable lining could increase the irritability of fleas, present in great numbers on the dogs which move freely in the villages, inside and outside human houses. When dogs come rest, or rub, on the walls with treated durable-lining, the fleas jump and become visible to people, who then complained, removed and discarded the treated plastic sheeting.
Adapted information-education-communication campaigns are needed.
In spite of these issues, the Balombo trial confirmed that insecticide-treated plastic sheeting has a potential role in community control of malaria (22), especially where previous house-spraying campaigns failed (for various reasons) or LLINs were not accepted well, not used, or misused.
Further, the combination of durable lining, treated with other than pyrethroid insecticide, paired with pyrethroid-treated LLINs, could be proposed as a complement to LLINs to increase the long lasting efficacy of vector control when LLIN, or IRS, have no more efficacy, and to address the burning issue of pyrethroid resistance.(64,65)
5.Conclusion
The first step of the Balombo project fulfilled its role in providing data and insight to improve decision-making support for the National Malaria Control Program; the protocol, and the data gained, will be useful for the implementation, monitoring, and evaluation of the vector control component of the National Program.
Annex
Vector control operation in Balombo villages.
(δ= deltamethrin; λ = lambdacyhalothrin)
Long-lasting insecticide-treated nets (LLINs)
LLINs were given free of charge in two villages: Caala and Cahata in three steps to get universal coverage
- February 2007: objective: at least one LLIN per house:
- Caala: distribution of 360 nets (= 257.4 gr a.i. δ) for 238 houses (= 1.08 gr a.i. δ/house)
- Cahata : 310 nets given (= 221.65 gr a.i. δ) for 138 houses = 1.61 gr a.i. δ//house;
- Total : 670 nets given (=479.05 gr a.i. δ) for 376 houses= 1.27 gr a.i. δ/house
- February 2008: objective: one net per “ sleeping unit”:
- Caala: distribution 277 nets
- Cahata distribution 195 nets
- December 2008: obtained actual full coverage: distribution of 49 nets in Caala and 25 in Cahata
- Total objective 1 net/sleeping unit :
- Caala : 277 + 49 = 326 nets (=233.1 gr a.i.. δ)/238 houses= 0.98 gr a.i. δ house
- Cahata : 195+25= 220 nets (= 157.3 gr a.i)/138 houses= 1.14 gr a.i δ /house
- Total; 546 nets (=393.39 gr a.i. δ)/376 houses=1.04 gr a.i. δ)/ house
- Therefore 686 nets given in Caala (for 469 sleeping unit noticed) and 530 in Cahata (for 422 sleeping units) to obtain actual universal coverage.
LLINs + Durable lining “Zero Fly’’®: December 2008
- Capango : 93 nets (= 66.5 gr a.i. δ) + 93 ZF (=639.8 gr a.i .δ)= 706.3 gr a.i .δ/60 houses= 11.77 gr a.i. δ/house;
- Canjala : 422 nets (= 301.7 gr a.i. δ ) + 621 ZF (=4272.2 gr a.i. δ) = 4573.9 gr a.i. δ /401 houses= 11.40 gr a.i. δ /house
- Total : 5280.2 gr a.i. δ /461 houses = 11.45 gr a.i. δ /house
Total: 515 LLINs and 714 ZeroFly® for 461 houses.
Wall Lining “Zero Vector”®: December 2008
Chisséquélé: 5,541 m2 (=941.97 gr a.i. δ)/181 houses= 5.20 gr a.i. δ /house
Barragem: 5,554 m2 (= 944.18 gr a.i. δ)/134 houses = 7.05 gr a.i. δ /house
Total: 11,095 m2 (=1,886.15 g a.i. δ)/315 houses= 5.99 gr a.i. δ / house
Total: 11,095 m2 of WL ZeroVector®
Indoor Residual Spraying then ITPS
- First round December 2008
- Libata : 12,825 m2 sprayed ; 61 sachets Icon® (=381.25 gr a.i. λ)/258 houses= 1.48 gr a.i. λ/house and 29,7 mg a. λ/m2
- Candiero : 9,500 m2 sprayed ; 39 sachets Icon® (=243.75 gr a.i. λ)/191 houses =1.28 gr a.i.λ/house and 25.7 mg a.i. λ/m2
- total 449 houses sprayed, 22,325 m2 ; 625 gr a.i. λ ; i.e. 1.39 gr a.i.λ/house and 27.9 mg a.i. λ/m2
- Second round June 2009
- Libata : 13,070 m2 sprayed ; 45 sachets Icon® (=281.25 gr a.i. λ)/263 houses= 107 gr a.i .λ/house and 21.5 mg a.i. λ/m2
- Candiero : 8,750 m2 ; sprayed ; 37 sachets Icon® (=231.25 gr a.i. λ)/176 houses = 1.31 gr a.i. λ/house and 26.4 mg a.i. λ/m2
- total 439 houses ; 21,820 m2 sprayed ; 512.5 gr a.i. λ; i.e. 1.17 gr a.i. λ/house and 23.5 mg a.i. λ/m2
- For the two rounds: 888 houses sprayed; 44,145 m2; 1,137.5 gr a.i; .e. 1.28 gr a.i .λ/house and 25.8 mg a.i. λ/m2.
- Insecticide Treated Plastic Sheeting (ITPS) January 2010
- Libata : 916 « Zero Fly » (= 6,301.7 gr a.i. δ)/491 houses= 12.83 gr a.i. δ /house
- Candiero: 4,914 m2 de Wall Lining (=835.38 gr a.i. δ)/209 houses= 3,99 gr a.i δ /house
Ethical Approval
Studies done at the request and with the National Malaria Control Program and the Public Health Provincial Department.
These surveys were a component of the Malaria Control Program of the Sonamet® Angolese Company
Acknowledgements
We would like to thank the managers of the Angolan company Sonamet® and its medical department; as well as the international company SubSea7® for their permanent support for this work and their implication in malaria control in the region.
We thank Dr Titelman who procured the material for vector control: nets and plastic sheeting.
Our thanks also to the national and provincial authorities for their authorization and participation in these studies as well as to the population of the villages who were actually involved in vector control operations.
We thanks Teacher John for Editing the English version
We thanks also Dr. S. Manguin for her interesting input at entomological level
Competing Interests
Authors have declared that no competing interests exist.
References
- Malária.(2019). PNdCd. Relatório Anual Descritivo da Malária. Ministério da Saúde de Angola.
View at Publisher | View at Google Scholar - PMI. U.S.(2020). President’s Malaria Initiative Angola Malaria Operational Plan. Washington DC.
View at Publisher | View at Google Scholar - Plucin. ski M, Ferreira M, Ferreira C, Burns J, P. G, Lubaki J, et al.(2017). Evaluating malaria case management at public health facilities in two provinces in Angola. Malar J; 16(1):186.
View at Publisher | View at Google Scholar - Plano Estratégico Nacional de Controlo da Malária em Angola. Programa Nacional de Controle da Malária, Ministério da Saúde de Angola; 2017.
View at Publisher | View at Google Scholar - Tavares W, Morais J, Martins J, Scalsky R, Stabler T, et al. (2022). Malaria in Angola: recent progress, challenges and future opportunities using parasite demography studies. Malar J. 21(1):396.
View at Publisher | View at Google Scholar - Fortes F, Dimbu R, Figueiredo P, Neto Z, do V, Rosario, Lopes D. (2011). Evaluation of prevalence’s of pfdhfr and pfdhps mutations in Angola. Malar J. 10(10):22.
View at Publisher | View at Google Scholar - Ebel E, Reis F, Petrov D, Beleza S. (2021). Historical trends and new surveillance of Plasmodium falciparum drug resistance markers in Angola. Malar J. 20(1):175.
View at Publisher | View at Google Scholar - Somandjinga M, Lluberas M, Jobin W. (2009). Difficulties in organizing first indoor spray programme against malaria in Angola under the President's Malaria Initiative. Bull Wld Hlth Org. 87(11):871-874.
View at Publisher | View at Google Scholar - Carnevale P, Toto J, Foumane V, Manguin S. (2021). Influence of Partial and Full Coverage on Long Lasting Deltamethrin Treated Nets (“Δllin”) on Plasmodium falciparum Parasitaemia in 2 Villages around Balombo Town (Benguela Province, Angola). J Biomedic Sci. 4(6):ID.000340.
View at Publisher | View at Google Scholar - Koenker H, Kumoji E, Erskine M, Opoku R, Sternberg E. (2023). Reported reasons for non-use of insecticide-treated nets in large national household surveys, 2009-2021. Malar J 22(1):61.
View at Publisher | View at Google Scholar - Burns M. (2005). Evaluating insecticide-treated polyethylene sheeting for malaria control in complex emergencies: an intersectorial approach. Humanitarian Exchange ; 31:14-16.
View at Publisher | View at Google Scholar - Messenger L, Miller N, Adeogun A, Awolola T, Rowland M. (2021). The development of insecticide-treated durable wall lining for malaria control: insights from rural and urban populations in Angola and Nigeria. Malar J; 18(11):332.
View at Publisher | View at Google Scholar - Graham K, Mohammad N, Rehman H, Nazari A, Ahmad M, et al. Insecticide-treated plastic tarpaulins for control of malaria vectors in refugee camps. Med Vet Entomol. 16(4):404-408.
View at Publisher | View at Google Scholar - Burns M, Rowland M, N'guessan R, Carneiro I, Beeche A, et al. (2012). Insecticide-treated plastic sheeting for emergency malaria prevention and shelter among displaced populations: an observational cohort study in a refugee setting in Sierra Leone. Am J Trop Med Hyg. 87(2):242-250.
View at Publisher | View at Google Scholar - Diabate A, Chandre F, Rowland M, N'guessan R, Duchon S et al. (2006). The indoor use of plastic sheeting pre-impregnated with insecticide for control of malaria vectors. Trop Med Int Health. 11(5):597-603.
View at Publisher | View at Google Scholar - Djènontin A, Chabi J, Baldet T, Irish S, Pennetier C. et al. (2009). Managing insecticide resistance in malaria vectors by combining carbamate-treated plastic wall sheeting and pyrethroid-treated bed nets. Malar J;8:233.
View at Publisher | View at Google Scholar - Djènontin A, Chandre F, Dabiré K, Chabi J, N'guessan R. et al. (2010). Indoor use of plastic sheeting impregnated with carbamate combined with long-lasting insecticidal mosquito nets for the control of pyrethroid-resistant malaria vectors. Am J Trop Med Hyg. 83(2):266-270.
View at Publisher | View at Google Scholar - Chandre F, Dabire R, Hougard J, Djogbenou L, Irish S. et al. (2010). Field efficacy of pyrethroid treated plastic sheeting (durable lining) in combination with long lasting insecticidal nets against malaria vectors. Parasit Vectors. 3(1):65.
View at Publisher | View at Google Scholar - Ngufor C, Tchicaya E, Koudou B, N’Fale S, Dabire R, et al. (2014). Combining Organophosphate Treated Wall Linings and Long-lasting Insecticidal Nets for Improved Control of Pyrethroid Resistant Anopheles gambiae. PLoS ONE.a; 9(1):e83897.
View at Publisher | View at Google Scholar - Messenger L, Matias A, Manana A, Stiles-Ocran J, Knowles S, et al. (2012). Multicentre studies of insecticide-treated durable wall lining in Africa and South-East Asia: entomological efficacy and household acceptability during one year of field use. Malar J. 11:358.
View at Publisher | View at Google Scholar - Messenger L, Larsen M, Thomas J, Rowland M. (2014). Installation of insecticide-treated durable wall lining: evaluation of attachment materials and product durability under field conditions. Parasit Vectors. 7:508.
View at Publisher | View at Google Scholar - Messenger L, Rowland M. (2017). Insecticide-treated durable wall lining (ITWL): future prospects for control of malaria and other vector-borne diseases. Malar J. 16(1):213.
View at Publisher | View at Google Scholar - Pulford J, Tandrapah A, Atkinson J, Kaupa B, Russell T, Hetzel M. Feasibility and acceptability of insecticide-treated plastic sheeting (ITPS) for vector control in Papua New Guinea. Malar J 2012; 11:342.
View at Publisher | View at Google Scholar - Sharma S, Upadhyay A, Haque M, Tyagi P, Mohanty S, et al. (2009). Field evaluation of ZeroFly®—an insecticide incorporated plastic sheeting against malaria vectors and its impact on malaria transmission in tribal area of northern Orissa. Indian J Med Res. 130(4):458–466.
View at Publisher | View at Google Scholar - Mittal P, Sreehari U, Razdan R, Dash A. (2011). Evaluation of the impact of ZeroFly®, an insecticide incorporated plastic sheeting on malaria incidence in two temporary labor shelters in India. J Vector Borne Dis. 48(3):138-143.
View at Publisher | View at Google Scholar - Carnevale P, Foumane Ngane V, Toto J, C., Dos Santos M, Fortes F. (2019). The Balombo (Benguela Province, Angola) Project: a village-scale malaria-vector control programme with a long term comprehensive evaluation. 6th PAMCA Annual Conference and Exhibition Strengthening surveillance systems for vector-borne disease elimination in Africa Yaoundé.
View at Publisher | View at Google Scholar - Brosseau L, Drame P, Besnard P, Toto J, Foumane. et al. (2012). Human antibody response to Anopheles saliva for comparing the efficacy of three malaria vector control methods in Balombo, Angola. PLoS One. 7(9):e44189.
View at Publisher | View at Google Scholar - Henry MC, Assi, S., Rogier C, Dossou-Yovo J, Chandre F. (2005). Protective efficacy of lambda-cyhalothrin treated nets in Anopheles gambiae pyrethroid resistance areas of Côte d'Ivoire. Am J Trop Med Hyg.73(5):859-864.
View at Publisher | View at Google Scholar - Odetoyinbo JA. (1969). Preliminary investigation on the use of a light-trap for sampling malaria vectors in The Gambia. Bull Wld Hlth Org.40:547-560.
View at Publisher | View at Google Scholar - Coz J, Hamon J, Vervent G, Sales S. (1971). Contribution à l'étude du piège lumineux
View at Publisher | View at Google Scholar - Carnevale P. (1974). Comparaison de 3 méthodes de captures pour l'échantillonnage d'une population d'Anopheles nili. Cah ORSTOM, sér Ent Méd Parasitol. 12(2):135-144.
View at Publisher | View at Google Scholar - Service M. (1976). Mosquito Ecology. Field Sampling Methods. Applied Science Publishers Ltd, London:583 p.
View at Publisher | View at Google Scholar - Sriwichai P, Karl S, Samung Y, Sumruayphol S, Kiattibutr K, et al. (2015). Evaluation of CDC light traps for mosquito in a malaria endemic area on the Thai-Myanmar border. Parasit Vectors. 8:636.
View at Publisher | View at Google Scholar - Gillies MT, De Meillon B. (1968). The Anophelinae of Africa South of Sahara. Ethiopian zoogeographical region. South Afr Inst Med res.343 p.
View at Publisher | View at Google Scholar - Burkot TR, Williams JL, Schneider L. (1983). Identification of Plasmodium falciparum infected mosquitoes by a double antibody enzyme linked immunosorbent assay. Am J Trop Med Hyg. 1984; 33:783-788.
View at Publisher | View at Google Scholar - Wirtz R, Zavala F, Charoenvit Y, Campbell G, Burkot T, et al. (1987). Comparative testing of monoclonal antibodies against Plasmodium falciparum sporozoites for ELISA development. Bull Wld Hlth Org. 65(1):39 - 45.
View at Publisher | View at Google Scholar - Fanello C, Santolamazza F, Della Torre A. (2002). Simultaneous identification of species and molecular forms of the Anopheles gambiae complex by PCR-RFLP. Med Vet Entomol. 16:461-464.
View at Publisher | View at Google Scholar - Fançony C, Brito M, Gil J. (2016). Plasmodium falciparum drug resistance in Angola. Malar J. 15:74.
View at Publisher | View at Google Scholar - PMI.(2020). President’s Malaria Initiative Angola Malaria Operational Plan 2020. Washington DC.
View at Publisher | View at Google Scholar - Morais J, Franscisco M, de Vasconcelos J, Fançony C, Brito M. et al. (2019). Epidemiological baseline cross-sectional study to monitor P. falciparum transmission intensity in Southern Angola. Luanda, Angola. INIS, CISA, Angolan NMCP, Elimination 8, UCSF, Global Fund. 49.
View at Publisher | View at Google Scholar - Carnevale P, Toto, JC., Foumane V, Carnevale S, Gay F. (2021). Co-Evolution of the Presence of Long Lasting Insecticide Treated Nets and Plasmodium falciparum Welch, 1897 Prevalence in Cahata Village (Benguela Province, Angola) during a Village Scale Long-Term of Malaria Vector Control Program. Asian J Res Inf Dis. 7(4):21-32.
View at Publisher | View at Google Scholar - Malima R, Emidi B, Messenger L, Oxborough R, Batengana B. et al. (2017). Experimental hut evaluation of a novel long-lasting non-pyrethroid durable wall lining for control of pyrethroid-resistant Anopheles gambiae and Anopheles funestus in Tanzania. Malar J. 16(1):82.
View at Publisher | View at Google Scholar - Mishra A, Bharti P, Kareemi T, Chand S, Tidgam A, et al. (2019). Field evaluation of Zero Vector® durable lining to assess its efficacy against malaria vectors and malaria transmission in tribal areas of the Balaghat district of central India. Trans R Soc Trop Med Hyg. 2113(10):623-631.
View at Publisher | View at Google Scholar - Giesbrecht D, Belleh T, Pontarollo J, Hinneh V, Pratt O, et al. (2023). Durable wall lining for malaria control in Liberia: results of a cluster randomized trial. Malar J. 22(1):15.
View at Publisher | View at Google Scholar - Graham K, Rehman H, Ahmad M, Kamal M, Khan I. et al. (2004). Tents pre-treated with insecticide for malaria control in refugee camps: an entomological evaluation. Malar J 3(1):1-7.
View at Publisher | View at Google Scholar - Chaccour C, Alonso S, Zulliger R, Wagman J, Saifodine A, et al. (2018). Combination of indoor residual spraying with long-lasting insecticide-treated nets for malaria control in Zambezia, Mozambique: a cluster randomized trial and cost-effectiveness study protocol. BMJ Glob Health. 3(1):e000610.
View at Publisher | View at Google Scholar - Cuamba N, Choi K, Townson H. (2006). Malaria vectors in Angola: distribution of species and molecular forms of the Anopheles gambiae complex, their pyrethroid insecticide knockdown resistance (kdr) status and Plasmodium falciparum sporozoite rates. Malar J ; 5(1):2.
View at Publisher | View at Google Scholar - Carnevale P, Toto J, Besnard P, Santos M, Fortes F, et al. (2015). Spatio-temporal variations of Anopheles coluzzii and An. gambiae and their Plasmodium infectivity rates in Lobito, Angola. J Vector Ecol. 40 (1):172-179.
View at Publisher | View at Google Scholar - Alves G, Jolomba V, Domingos A, Feliciano A, Pedro C, et al. (2021). Entomological surveillance of Anopheles mosquitoes in the province of Cuando-Cubango, Angola, 2020–2021. Annual meeting Amer soc trop med hyg.
View at Publisher | View at Google Scholar - Bafort J. (1985). Anopheles marshalli s.l., a secondary vector of malaria in Africa. Trans R Soc Trop Med Hyg. 79(4):566-567.
View at Publisher | View at Google Scholar - Massebo F, Balkew M, Gebre-Michael T, Lindtjørn B. (2015). Zoophagic behaviour of anopheline mosquitoes in southwest Ethiopia: opportunity for malaria vector control. Parasit Vectors. 8:645.
View at Publisher | View at Google Scholar - Foumane V, Besnard P, Le Mire J, Foucher J, Soyto A, et al. (2009). Enquêtes paludométriques en 2006 et 2007 dans la province de Benguela, Angola. Sciences et Médecines d'Afrique. 1: 60-65.
View at Publisher | View at Google Scholar - Carnevale P, Dos Santos M, Moniz Soyto A, Besnard P, Foumane V,et al. (2018). Parasitological Surveys on Malaria in Rural Balombo (Angola) in 2007-2008. Base Line Data for a Malaria Vector Control Project. Int J Trop Dis. 2018; 31(3):1-12.
View at Publisher | View at Google Scholar - Eisele T, Thwing J, Keating J. Claims about the Misuse of Insecticide-Treated Mosquito Nets: Are These Evidence-Based? PLoS Med. 2011; 8(4):e1001019.
View at Publisher | View at Google Scholar - Monroe A, Moore S, Olapeju B, Merritt A, Okumu F. (2021). Unlocking the human factor to increase effectiveness and sustainability of malaria vector control. Malar J. 20(1):404.
View at Publisher | View at Google Scholar - Pulford J, Hetzel M, Bryant M, Siba P, Mueller I. (2011). Reported reasons for not using a mosquito net when one is available: a review of the published literature. Malar J. 10:83.
View at Publisher | View at Google Scholar - Bouvier P, Rougemont A, Breslow N, Doumbo O, Delley V, et al. Seasonality and malaria in a West African village: does high parasite density predict fever incidence? Am J Epidemiol. 145(9):850-857.
View at Publisher | View at Google Scholar - Rogier C, Commenges D, Trape J. (1996). Evidence of an age dependent pyrogenic threshold of Plasmodium falciparum parasitaemia in highly endemic populations. Am J Trop Med Hyg. 54(6):613–619.
View at Publisher | View at Google Scholar - Rogier C, Fusai T, Pradines B, Trape J-F. (2005). Comment évaluer la morbidité attribuable au paludisme en zone d'endémie ? Rev Epidém et Santé Publique. 53:299-309.
View at Publisher | View at Google Scholar - Rogier C, Henry MC, Spiegel A. (2001). Diagnostic des accès palustres en zone d'endémie: bases théoriques et implications pratiques. Méd Trop. 61:27-46.
View at Publisher | View at Google Scholar - Benelli G, Beier J. (2017). Current vector control challenges in the fight against malaria. Acta Trop. 2017; 174:91-6.
View at Publisher | View at Google Scholar - Kruger T, Sibanda M, Focke W, BornmanM, de Jager C. (2015). Acceptability and effectiveness of a monofilament, polyethylene insecticide-treated wall lining for malaria control after six months in dwellings in Vhembe District, Limpopo Province, South Africa. Malar J.14:485.
View at Publisher | View at Google Scholar - Kuadima J, Timinao L, Naidi L, Tandrapah A, Hetzel M, et al. (2017). Long-term acceptability, durability and bio-efficacy of ZeroVector® durable lining for vector control in Papua New Guinea. Malar J. 16(1):93.
View at Publisher | View at Google Scholar - Hemingway J, Ranson H, Magill A, Kolaczinski J, Fornadel C. et al. (2016). Averting a malaria disaster: will insecticide resistance derail malaria control? Lancet. 387(10029):1785-1788.
View at Publisher | View at Google Scholar - Ranson H, Lissende N. (2016). Insecticide resistance in African anopheles mosquitoes: a worsening situation that needs urgent action to maintain malaria control. Trends Parasitol. 32:187–196.
View at Publisher | View at Google Scholar
