

Research Article | DOI: https://doi.org/10.31579/2834-5010/005
The A1c Lowering Effect Prediction on The Basis of The Ediazer Study
1 Azerbaijan State Advanced Training Institute for Doctors named after A. Aliyev, Baku, Azerbaijan.
*Corresponding Author: Valeh A. Mirzazada, Azerbaijan State Advanced Training Institute for Doctors named after A. Aliyev, Baku, Azerbaijan.
Citation: Richmond R Gomes (2022). Multiple Splanchnic Venous Thromboses: A Fatal Complication of Recurrent Pancreatitis. International Journal of Clinical Therapeutics. 1(1); DOI:10.31579/2834-5010/005
Copyright: © 2022 Valeh A. Mirzazada, This is an open access article distributed under the Creative Commons Attribution License, which permits unrestricted use, distribution, and reproduction in any medium, provided the original work is properly cited.
Received: 12 August 2022 | Accepted: 15 September 2022 | Published: 21 September 2022
Keywords: diabetes mellitus; A1c; fasting glucose; glucose lowering effect prediction; Gliclaside MR; metformin
Abstract
The optimization and predictability of metformin and sulfonylurea therapy remains relevant especially for low-‐‑ and middle-‐‑income countries.
The purpose of this study was to create equations for predicting changes in glycohemoglobin during monotherapy by gliclazide MR or combination therapy by Gliclazide MR plus Metformin in DM2.
Material and Methods.
The data of 105 patients with DM2 who took part in the EdiAzer Study were analyzed. Subjects were required to make six visits to the center at Weeks 0 (W0), 2 (W2), 4 (W4), 6 (W6), 8 (W8), and 16 (W16). HbA1c levels were measured at Weeks 0 and 16. Fasting plasma glucose (FPG), height, weight, body mass index, and blood pressure were measured at all visits.
Results: "Success of Glucose-‐‑Lowering Effect" (SGLE), which should mean the difference between HbA1 values at the start (W0) and at the end (W16) of the study. Statistically significant correlation between SGLE and FGW0 (r = +0,38; p < 0,001); the difference between FGW0 and FGW2 (r = +0,44; p < 0,001); the difference between FGW2 and FGW4 (r = +0,28; p < 0,01); HbA1c W0 (r = +0,70; p < 0,0001) was shown. 6 models were constructed that allow predicting the results of 4 months treatment.
Conclusion: Although it is generally accepted that HbA1c should be checked every 3 months, checking it once every 4 months also gives quite a predictable result. Already at the end of the first month of treatment it is possible to predict the result of changes in HbA1c after 16 weeks of treatment. To do this, it is necessary to have on hand such indicators as HbA1cW0, FGW0, FGW2, FGW4. The most accurate prediction result is achieved when using all these parameters in a complex (Preform DiA1c6 index).
Abbrevations:
DM – diabetes mellitus
DM2 – diabetes mellitus type 2 FPG – fasting plasma glucose
FPGW0 – fasting plasma glucose at the start of the study FPGW2 – fasting plasma glucose at the point W2
FPGW4 – fasting plasma glucose at the point W4 SGLE – Success of Glucose-‐‑Lowering Effect
HbA1cW0 – Glycated Hemoglobin at the start of the study (week 0) HbA1cW16 – Glycated Hemoglobin at the end of the study (week 16) Preform DiA1c – Predictive Four Months Difference in HbA1c
SD – standard deviation
W0 – the start of the study (week 0)
W2 – week 2 or the second week after the study start W4 – week 4 or the fourth week after the study start W6 – week 6 or the sixth week after the study start W8 – week 8 or the eighth week after the study start
W16 – week 16 or the sixteenth -‐‑ the final week of the study
Introduction
An estimated 537 million adults, or 10.5% of the world’s population, aged 20–79 years are currently living with diabetes (DM). The total number is predicted to rise to 643 million (11.3%)by 2030 and to 783 million (12.2%)by 2045 [1].
Simple calculations of the IDF Diabetes Atlas data [1] show that the number of people with diabetes will increase by 13.8 million in high-‐‑income countries (according to the World Bank income classification), by 2093 million in middle-income countries and by 23.5 million in low-‐‑income countries. The total number of people with diabetes living in low-‐‑ and middle-income countries will increase from 432.7 million in 2021 to 665.5 million by 2045. The proportion of people with diabetes living in middle- and low-income countries will increase from 80.6% in 2021 to 85.0% by 2045.
Type 2 diabetes (DM2) accounts for the vast majority (over 90%) of diabetes [1,2]. Blood glucose control is an essential component of an integrated approach to diabetes management [2-4].
The first-‐‑line drug position gradually moves from metformin to GLP-‐‑1 RA and SGLT2 inhibitors [2,3], since these medications, along with the glucose-‐‑lowering effect, also have a cardio-‐‑ and reno-‐‑protective effect, reduce body weight and are relatively safe against hypoglycemia [2,3,4]. However, these new and very promising drugs are expensive and the majority of pati in the world continue to receive treatment with metformin and sulfonylureas [5].
Thus, the problem of optimization and predictability of metformin and sulfonylurea therapy remains relevant. In accordance with modern recommendations, initiation of glucose lowering therapy can begin as monotherapy [2-4] and as combinate therapy [3]. Previously we analyzed results of monotherapy by gliclazide MR or combination therapy by Gliclazide MR plus Metformin in DM2 (Edi Azer Study) [6]. The study presented in this article was conducted on the basis of Edi Azer Study data.
The purpose of this study was to create equations for predicting changes in glyco hemoglobin during monotherapy by gliclazide MR or combination therapy by Gliclazide MR plus Metformin in DM2.
Materials and Methods
EdiAzer was an open-‐‑label, non-‐‑comparative observational study consisting of a 2-‐‑month inclusion period and 4 months of follow-‐‑up. The study was conducted according tothe standards and principles of theDeclaration of Helsinki. Ethical approval was site specific, and written informedconsent was obtainedfrom all patients at the inclusion visit. The trial was registered on the ClinicalTrials.gov website with the number NCT03164187.
The study recruited: treatment-‐‑naive patients with newly diagnosed DM2; patients without pharmacotherapy which were uncontrolled despite diet and physical activity; patients uncontrolled with metformin monotherapy for whom treating physicians had already decided to prescribe gliclazide MR. Detailed information about the study, the criteria for inclusion in the study and exclusion from it was presentedin a previous publication [6].
The flow of participants throughthe study is shown in Figure1.
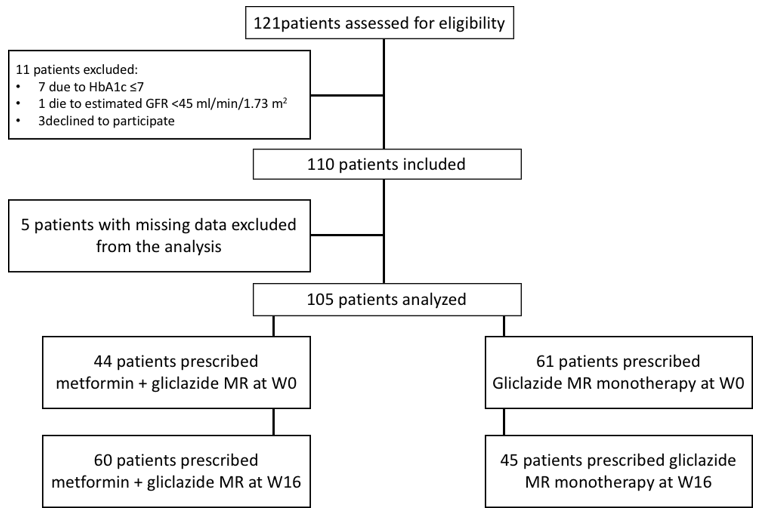
Figure 1: The flow of participants through the study Edi Azer
Subjects were required to make six visits to the center at Weeks 0 (W0), 2 (W2), 4 (W4), 6 (W6), 8 (W8), and 16 (W16). HbA1c levels were measured at Weeks 0 and 16. Fasting plasma glucose (FPG), height, weight, body mass index, and blood pressure were measured at all visits.
Patient demographics and baseline characteristics were shown early [6].
Statistical analysis: Quantitative variables were summarized by mean standard deviation. Correlation analysis and multiple linear regression method were used [7]. Chi-‐‑square or Fisher exact tests were used to determine the statistical significance of differences between proportions [8]. Student t tests for paired samples were used to compare mean values over time. A p value less than 0 was considered statistically significant.
Results
To simplify the discussion of the results obtained, we introduce the term "Success of Glucose-‐‑Lowering Effect" (SGLE), which should mean the difference between HbA1 values at the start (W0) and at the end (W16)of the study. That is
SGLE = HbA1cW0 – HbA1cW16
Since it is a priori known that SGLE is the resulting parameter, the use of correlation analysis gives us the opportunity to determine the degree of various factors influence on SGLE.
We have studied the influence of factors such as the age of the study participants, duration of DM, complications of DM, height, weight at W0 and W16, body mass index at points W0 and W16, systolic and diastolic blood pressure on the values of SGLE. In all these cases, the values of the correlation coefficients were not statistically significant (p > 0.05).
Doses of gliclazide MR and/or metformin at the end of the EdiAzer study (W16) also had no statistically significant (p > 0.05) effect on the values of SGLE.
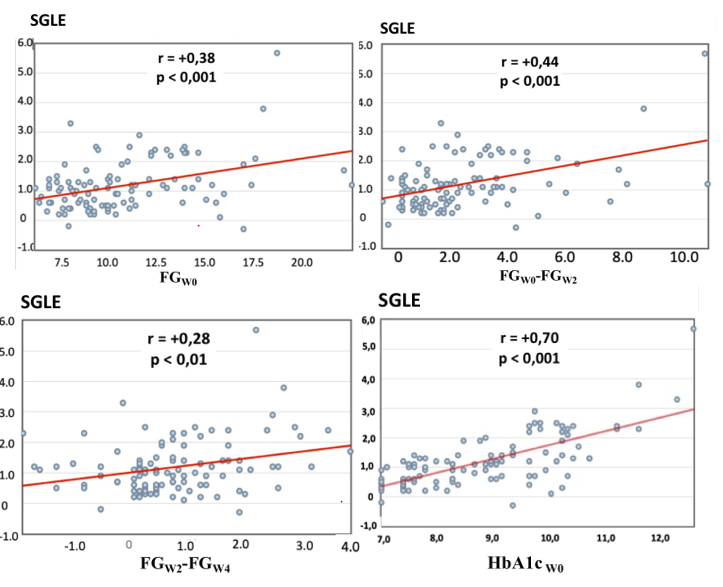
Figure 2: Correlation betweenSGLE and FGW0; SGLE and difference of FG W0 and FGW2; SGLE and difference of FG W2and FGW4; SGLE and HbA1c W0
As can be seen from Fig. 2, a statistically significant correlation between SGLE on the one hand and FGW0 (r = +0,38; p < 0 xss=removed r = +0,28;p r = +0,70;p >
In this regard, using the linear regression method, 6 models were constructed that allow predicting the values of 4 months (16 weeks) after the start of monotherapy with gliclazide MR and/or combination therapy with gliclazide MR plus metformin.
The calculated indicator SGLE, obtained as a result of using the model, was named by us Preform DiA1c (Predictive Four MonthsDifference in HbA1c).
These models are presented in Table 1.
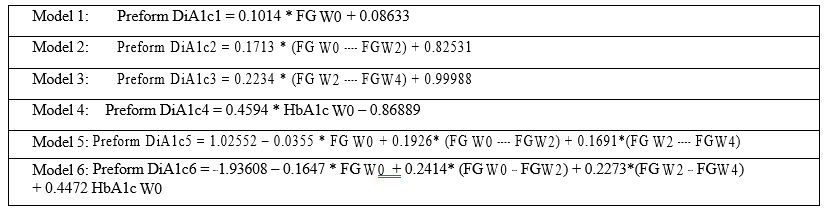
Table 1: statistical Models for prediction of the difference between HbA1c at the start of therapy by Gliclazide MR and/orGliclazide MR plus Metforminand after four months of therapy.
Figure 3 shows the results of the correlation analysis of the relationships between SGLE and Preform DiA1c indicators obtained in accordance with models 1-6.
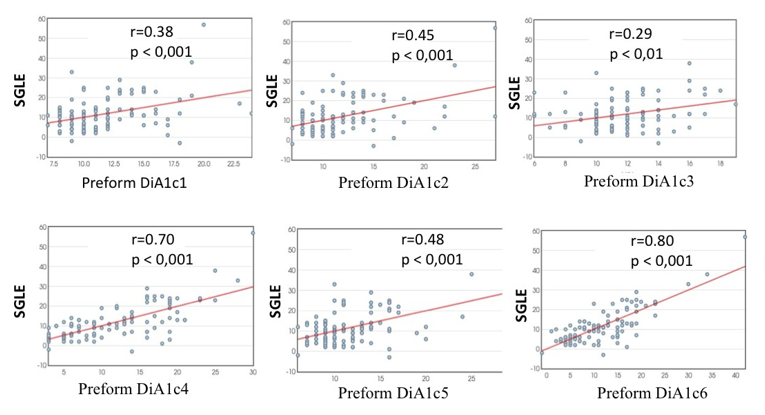
Figure 3: Correlation between SGLE and Preform DiA1c indicators obtained in accordance with models 1-‐‑ 6.
As can be seen from Figure 3, the correlation coefficient was minimal for Model 3 (r = + 0,29; p < 0,01) and maximal for model 6 (r = + 0,80; p < 0,001).
Figure 4 shows the values of the standard deviation (SD) of the difference
between the SGLE values, that is, the real HbA1cw16 and the values of the predicted by models 1-‐‑6 HbA1c (Preform DiA1c).
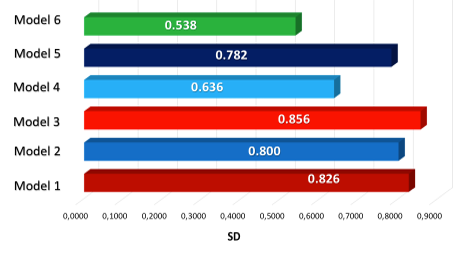
Figure 4: Values of the standard deviation (SD) of the difference between the SGLE values, that is, the real HbA1cw16 and the values of the predicted by models 1-6 HbA1c (Preform DiA1c).
As expected, the average values of the difference between SGLE and Preform DiA1c were equal to 0 in all 6 groups. From Figure 4, it can be seen that the smallest SD occurred when using Model 6. This shows the minimal spread of data typical for calculations based on this model, the greatest proximity of the results of calculation by Model 6 (Preform DiA1c)to the actual SGLE.
Next, we studied the absolute values of the differences between SGLE and Preform DiA1c calculation by Models 1-6.
Figure 5 shows the average of the absolute values of the difference between SGLE and PreformDiA1c calculation by Models 1-6.
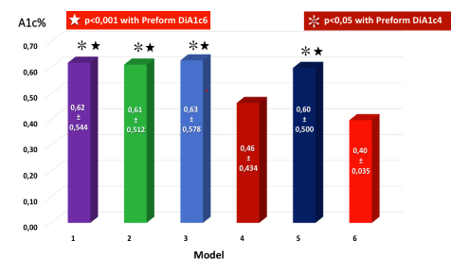
Figure 5: Average of the absolute values of the difference between SGLE and Preform DiA1c calculation by Models 1-‐‑6.It can be seen from Figure 5 that the smallest absolute values of the difference between SGLE and Preform DiA1c were characteristic of the model 6. Moreover, the differences between model 6 results and results of models 1, 2, 3, 5 were statistically significant (in all cases p < 0.001).
Discussion
The establishment of individual glucose management goals is the basis on which further glucose-‐‑lowering therapy is based. The main target indicator is a more stable HbA1c [2]. The generally accepted standard is the definition of a level HbA1c one time in three months [2,3,4] and this is due to the fact that the average duration of red blood cell circulation is 120 days [9]. However, in recent years, doubts have been raised about the absolute validity of the 120-‐‑day period [10]. In the EdiAzer Study HbA1c determined 1 time in 4 months [5]. The results presented in this article demonstrate that even when determining 1 every 4 months, HbA1c remains a completely predictable indicator.
The possibility to reduce the HbA1c definitions number for each DM2 patient from 4 times per year to 3 times per year may be economically
feasible, especially for low-‐‑ and middle-‐‑income countries.
At the same time, less frequent monitoring of HbA1c increases the need for greater predictability of expected results and controlof the adequacy of the results obtained to the set target parameters.
Our research has shown that at the end of the first month treatment by Gliclizide MR or Metformin + Gliclizide MR, it is possible to predict HbA1c changes after 4 months of treatment. To do this, it is necessary to have on hand such indicators as HbA1cW0, FGW0, FGW2, FGW4. The most accurate prediction result is achieved when using all these parameters in a complex (PreformDiA1c6)
The possibility of prediction also means the possibility of timely correction of therapy. This is especially important for those cases where the results of the received prognosis do not correspond to the goals of treatment.
Acknowledgement
We thank the participants of this study.
Conflict of Interest
This study was supported by Servier. Medical writing support was provided by Jenny Grice, a freelance medical writer, and funded by Servier.
References
- IDF Diabetes Atlas 10th edition. (2021). International Diabetes Federation.
View at Publisher | View at Google Scholar - American Diabetes Association. (2022). Standards of Medical Care in Diabetes. Diabetes Care, 45(Supplement 1):S1-‐‑S264.
View at Publisher | View at Google Scholar - Garber A.J., Handelsman Y., Grunberger G., Einhorn D., Abrahamson M.J. et al. (2020). Consensus Statement by the American Association of Clinical Endocrinologists and American College of
View at Publisher | View at Google Scholar - Endocrinology on the Comprehensive type 2 Diabetes Management Algorithm – 2020 Executive Summary. Endocrine Practice, 26(1):107-‐‑139
View at Publisher | View at Google Scholar - Cosentino F., Grant P.J., Aboyans V., Bailey C.J., Cheriello A. et al. (2019). ESC Guidelines on diabetes, pre-‐‑diabetes, and cardiovascular diseases developed in collaboration with the EASD. The Task Force for diabetes, pre-‐‑diabetes, and cardiovascular diseases of the European Society of Cardiology (ESC) and the European Association for the Study of Diabetes (EASD). European Heart Journal, 41:255-‐‑323
View at Publisher | View at Google Scholar - O’Donoghue M.L., Kato E.T., Mosenzon O., Murphy S.A., Cahn A. et al. (2021). The efficacy and safety of dapagliflozin in women and men with type 2 diabetes mellitus. Diabetologia, 64(6),1226-‐‑1234.
View at Publisher | View at Google Scholar - Mirzazada V.A., Huseynova R.A., Mustafayeva S.A., Gasimova F.N., Ahmadova U. et al. (2020). Evaluation of Type 2 Diabetes Treatment with Gliclazide Modified Release in Azerbaijan (the EdiAzer Study): Results from a 16-‐‑week Observational Clinical Study. Journal of Diabetology, 11(3):175-‐‑182.
View at Publisher | View at Google Scholar - Social Science Statistics. Statistics Calculators. (2020).
View at Publisher | View at Google Scholar - Stats.Blue.
View at Publisher | View at Google Scholar - Nitin S. (2010). HbA1c and factors other than diabetes mellitus affecting it. Singapore Med J., 51:616-‐‑622.
View at Publisher | View at Google Scholar - Fernandez A. C., Fernandez A. C. (2017). How do red blood cells know when to die? R. Soc. open sci., 4(4):1-‐‑12
View at Publisher | View at Google Scholar
