

Review Article | DOI: https://doi.org/10.31579/2834-5126/075
Remediation of colored textile industry wastewaters via cellulose/SnO2 nanocomposite
- Delia Teresa Sponza *
Dokuz Eylül University, Engineering Faculty, Environmental Engineering Department, Buca İzmir TURKEY.
*Corresponding Author: Delia Teresa Sponza., Dokuz Eylül University, Engineering Faculty, Environmental Engineering Department, Buca İzmir TURKEY.
Citation: Delia Teresa Sponza., (2024), Remediation of colored textile industry wastewaters via cellulose/SnO2 nanocomposite., Clinical Trials and Clinical Research, 3(5); DOI:10.31579/2834-5126/075
Copyright: © 2024, Delia Teresa Sponza. This is an open access article distributed under the creative commons’ attribution license, which permits unrestricted use, distribution, and reproduction in any medium, provided the original work is properly cited.
Received: 15 August 2024 | Accepted: 20 September 2024 | Published: 30 September 2024
Keywords: color; textile industry; cellulose/SnO2; congo red dye; photodegradation; nanocomposite
Abstract
In this study a bio-based polymers namely cellulose/SnO2 was used for the degradation of colored wastewater from a textile industry containing congo red dye. The physicochemical properties of the cellulose/SnO2 nanocomposite were investigated by SEM, HRTEM, TEM, XPS and XRD. SEM results showed that the surface of cellulose/ SnO2 nanocomposite morphology has smooth structure. XRD peaks exhibited a Casserite structure of SnO2. XPS analysis illustrated the presence of SnO2-coated cellulose films. TEM images of cellulose /SnO2 nanocomposite exhibited a uniform spherical shape of SnO2 nanoparticles without any aggregation. For maximum photodegradation yields of congo red dye (99%) the optimized conditions should be as follows: congo red dye concentration 400 mg/l, cellulose/SnO2 nanocomposite concentration 1.5 mg/l, photodegradation time 40 min, UV light power 40 W/m2, pH =5,00 temperature 40 Oc, dissolved oxygen concentration 3 mg/l and ion concentration of 0,05 mg/l NaCl, KNO3 and NaHCO3).
1.Introduction
Due to extensively global industrialization textile, paper, leather industries utilize different organic dyes ending with excessive toxic emissions to the ecosystem. 43–53% of these organic in wastewater [1-2] Moreover, the presence of these organic dyes affect negatively the photosynthesis and some health problems increased in humans [3-4]. It is important treat the colored wastewaters before discharged to the receiving environments. Various chemical and physical methods, including coagulation, adsorption, membrane filtration, reverse osmosis, and photocatalysis, was used to remove organic dyes from wastewater [5-6]. Among these processes, photocatalysis has emerged as an efficient method to treat the pollutants from wastewaters. This eco-friendly, cost-effective, low-energy, and sustainable treatment approach was found to be effective in the removal of color from textile industry wastewaters. Due to the activity of photoinduced holes and the reduction capability of electrons, a series of photocatalytic processes can convert macromolecular organic contaminants like dyes into simpler and less hazardous molecular compounds.
Congo red is a toxic anionic azo dye. Because of its attraction to cellulose fibers, it has many industrial applications, including the wide use in the textile industry. Furthermore it is a pH indicator and is used to diagnose amyloidosis. Congo red also metabolizes to benzidine wich is a carcinogenic to humans. it cause respiratory problems and toxicities in skin, and gastrointestinal discomfort[7-8]. Congo dye is a sodium salt and gives red colour on the applied cotton. As on addition of acid, its colour changes so it is also not used as a dye generally. Mostly it is used as an indicator. It is blue in acidic solution (below pH 3) and red in solutions (above pH 3). The change in colour from red to blue in the acidic solution is due to the resonance among charged canonical structures[9].
Among nano metal oxides, SnO2 NPs can be used as photocatalyst to photodegrade large amount of dye stuff like congo red, methyl red and azo dye namely a sodium salt of 3, 3′-((biphenyl)-4,4′-diylbis(azo))-bis(4-amino-1-naphthalenesulphonicacid[9]. This metal oxide composed of both Sn4+ and Sn2+. In recent studies some semiconductors like CeO2 and SnO2 are extensively used. SnO2 is transparent in the visible ultraviolet region of the solar spectrum, at a wavelength of 350 nm. SnO2 was used in can be utilized in the decomposition of toxic organics in wastewater [10]. It is used alone and was not combined with other nanocomposites like TiO2, ZnO and MgO. Sn2+ was not utilized as photocatalyst since cause to oxygen vacancies during photodegradation. Since its utilization is as powder some difficulties was detected in the settling of solid phase. In order tp prevent this phenomenon this nano metal oxide was doped to a porous materials, to generate fibers. Nonetheless, the polymer based films lack the high surface area, necessary for a highly reactive system to be used in photocatalytic applications[10].
Cellulose-based materials, due to their large abundance, ease in use, availability, low cost and physicochemical characteristics with the particular structures are widely used and are efficient as compared to other adsorbent materials, i.e., commercial activated carbon which is much more expensive. Various types of biomass including algae, fungi, yeast and bacteria have provided efficient adsorbents for wastewater treatment, i.e., many enzymes are available for mineralization as well as degradation of the dyes released from textile industries into water bodies . The desired characteristics of photocatalysts are better to meet by the cellulose-based as photodegradation yield for removal of methylene blue, Drimarine Yellow HF-3GL and Malachite green[11-12].
Formation of SnO2 NPs on porous polymer substrates would be a promising route towards the exploration of the possibility to use this semiconductor based solid system for water treatment applications. The solid-state SnO2 photocatalysts would offer the advantage of mechanical flexibility, manageability, but also would not require complicated steps for their recovery after the remediation process, minimizing the possibility of secondary pollution. It is low cost photocatalysts and recyclable[13].
Cellulose is a natural polysaccharide, synthesized from the green plants and also by some microorganisms. The mixing of cellulose with SnO2 may provide an economic and environmentally-friendly solution for photodegradation and decomposition of some organic chemicals. Cellulose is chosen since its origin is biologic with low cost and easy utilizable [14-15].
Therefore, in this study the SnO2 NPs doped to cellulose to product porous polymer substrates as a low cost to decolorization of textile wastewaters containing Congo dye. The effects of some operational conditions( nanocomposite concentration, congo dye concentration, Ph, temperature, photodegradation time , sun light intensity, dissolved oxygen concentration and the concentration of some ions) on the phptpdegradation congo dye was researched.
Materials and methods

Characterization of cellulose/SnO2 nanocomposite
The physicochemical properties of cellulose/SnO2 nanocomposite was performed with XRD-analysis (Advance Powder X-ray diffractometer, Germany), FT-IR (Alpha T Bruker), TEM (JEOL 2100, EDAX (Bruker, Germany) and. Photo Degradation of textile industry wastewater.
The Congo red containing textile industry wastewater samples was photodegraded in a Photoreactor at 365 nm having a volüme of 5 liter and illuminated with sun ligth at different sun ligth powers. The photodegradation tests were performed by recording the decrease of the characteristic absorption peak at the corresponding max every 30 minutes. The ?gradation of the dye was calculated using the following equation: (%) = ????0−(????) ????0 × 100%.
Where C0 is the standard concentration of each dye before irradiation and C(t) is the concentration of the dye solutions at time t during the photocatalytic process
Measurement of color in the samples
At certain time intervals the color in the samples were measured in UV–vis spectroscopy( Agilent, USA).
Preparation of cellulose/SnO2 nanocomposite
Cellulose was dissolved in 40 mL of acetone containing dimethyl form amide mixed at a ratio of 8 to 2 and stirred at 70°C. Then Subsequently, 0.227 g of SnPrec was dissolved in 3 mL of the same solvent mixture upon stirring at 45°C and 400 rpm for 30 minutes. SnPrec was transferred to SnO2 crystalline. The mixture were stirred and decanted.. The obtained Cellulose/SnPrec) was dried under vacuum for 15 hours then it maintained in an incubator at 124°C for 96 hours.
Results and Discussions
Physicochemical analysis results
SEM analysis results in cellulose/ SnO2 nanocomposite
The structure of cellulose did not vary after doping of SnPrec. The surface of cellulose/ SnO2 nanocomposite morphology exhibited a smooth structure. The size of cellulose was measured as 1.00 mm, while the size of cellulose/SnO2 nanocomposite was measured as 0.9 mm. This can be explained by a non significant change of the viscosity of the aforementioned nanocomposite(14, 17). Figure 1a exhibited the SEM picture of cellulose, while Figure 2a and 2b show the cellulose /SnO2 nanocomposite at two different magnifications.
 |  |  |
a (magnification 500 x) b (magnification 500 x) c (magnification 1200 x)
Figure 1: SEM morphology of cellulose at 500 x magnification(a), cellulose /SnO2 nanocomposite at 500x magnification (b) and (c) cellulose /SnO2 nanocomposite at 1200x magnification.
XRD analysis results in cellulose/ SnO2 nanocomposite
The XRD analysis of the cellulose/SnO2 nanocomposite exhibited the crystal structure of SnO2 nanoparticle (Figure 2). Cellulose /SnPrec composite exhibited an is amorphous shape. The peaks exhibited a Casserite structure of SnO2 with maximum disturbances at (114), (013), (024), (124), (224), (134), (224) and (114). In all disturbances, the maximal peaks of the cellulose were as follows: the carbonaceous links were located at 1740 cm-1 while the methyl links of the acetate located at 1219 cm-1 and 1423 cm-1 ,respectively. The -CH2 moieties was found at 1439 cm-1, while bounds of -C-O-C- located at 1045 cm.-1.
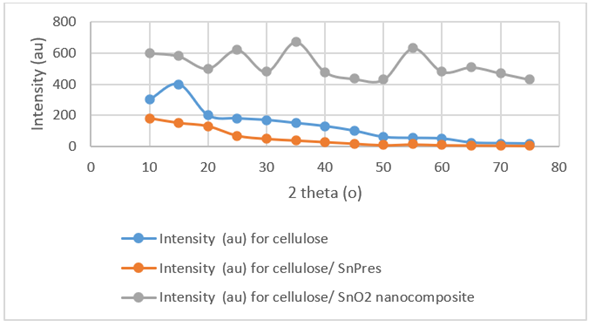
Figure 2: XRD analysis of the cellulose/SnO2 nanocomposite, SnO2 nanoparticle and Cellulose /SnPrec XPS analysis results for cellulose/ SnO2 nanocomposite.
XPS analysis is performed in order to elucidate the oxidation state of the Sn in SnO2 and to characterize the cellulose/ SnO2coating. Figure 3 illustrated the presence of SnO2-coated cellulose films. During disturbances, Sn3d5/2and Sn3d3/2peaks were detected at 489.2 and 496.8 eV, respectively. The binding energy of 493.1 eV exhibited similar data to the values for SnO2(492.3 and 486.6 eV) and higher than those of Sn metal(496.8, 489.7 and 489.2 eV). The atoms in the SnO2 coating were positively charged and generates bonds with oxygen(14-15). The O1s spectrum exhibited a maximal peak at 589.9 eV.
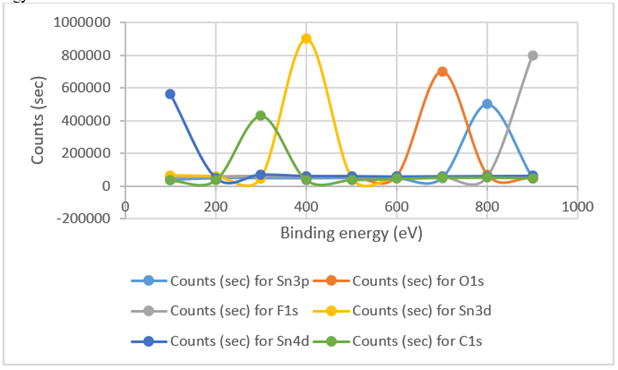
Figure 3: XPS analysis results for moieties of cellulose/ SnO2 nanocomposite
Specific surface areas for cellulose/ SnO2 nanocomposite
The Brunauer–Emmett–Teller Specific surface areas and pore volume of cellulose /SnO2 nanocomposite were measured as 149.9 m2 g−1 and 0.203 cm3 g−1, respectively. The hysteresis slope of the nanocomposite found as 18 nm. This shows that the presence of mesopores and has micropores (12,15).
Nitrogen adsorption desorption isotems of cellulose/ SnO2 nanocomposite.
The addition of SnO2 nano metal oxide increased the size of Cellulose/SnO2 nanocomposite to 123 m2 g−1. The mesopores structure will shorten the bonding of congo dye during photocatalytic degradation( Figure 4).
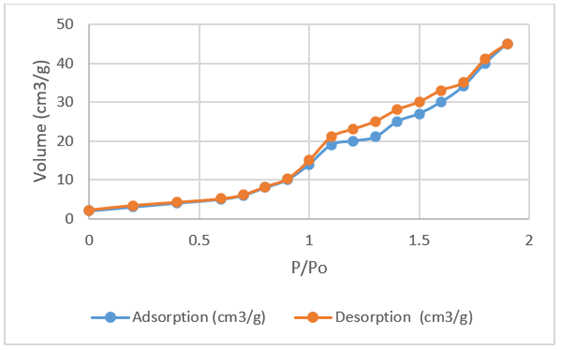
Figure 4: Nitrogen adsorption and desorption isotems of cellulose/ SnO2 nanocomposite
TEM and HRTEM analysis results of cellulose/ SnO2 nanocomposite
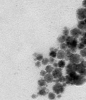
TEM and high-resolution TEM (HRTEM) analysis results of cellulose/ SnO2 nanocomposite is displayed in Figure 6a and 6b. TEM images of cellulose /SnO2 nanocomposite exhibited an uniform structure of SnO2 nanoparticles without generation of enlarged aggregation(13-15). The nanocomposite has a spherical shape corresponding to the pictures found in SEM images. The HRTEM image (Figure 6b) indicates the SnO2 nanoparticles in a crystal shape corresponding to the 114 plane of the SnO2. The C in the cellulose shows bound of SnO2 into carbonaceous materials during photocatalysis.
 |  |
A | B |
Figure 6: TEM (a) and HRTEM pictures of cellulose/ SnO2 nanocomposite
Effect of initial congo red concentration on the photodegradation yield of congo red dye
The initial concentration of congo RED dye affect significantly the photocatalytic. In this study the photodegradation percentage of congo dye decreased from 99% to 74% as the congo dye concentration was increased from 50 mg/l to 600 mg/l. As the congo dye concentration increases, more organic substances are adsorbed on the surface of cellulose/ SnO2 nanocomposite. As a result, low number of photons present to reach the cellulose/ SnO2 nanocomposite surface and therefore low •OH radicals were generated ending with low decolorization for congo dye. The photodegradation of congo red elevated at low congo dye concentrations. Table 1 shows the congo dye decolorization yields versus congo red concentrations at 1.5 mg/L cellulose/ SnO2 nanocomposite
Congo red concentration (mg/l) | Congo red decolorization yields (%) |
50 | 99 |
100 | 99 |
200 | 99 |
300 | 99 |
400 | 99 |
500 | 98 |
600 | 74 |
700 | 63 |
Table 1: Effect of initial concentrationof congo red dye on congo dye photodegradation yield.
Effect of cellulose/ SnO2 nanocomposite concentration on congo dye photodegradation yield
In this study the cellulose/ SnO2 nanocomposite concentration was increased from 0.5 mg/l up to 4 mg/l to detect the optimal nanocomposite concentration on maximal congo dye photodegradation yields. The maximum congo red photodegradation efficiency was detected at 1.5 mg/l nanocomposite concentration (Table 2). The photodegradation of congo dye increases with increasing nanocomposite amount up a certain concentration. The optimum nanocomposite amount elevated the number of active sites on the nanocomposite surface ending with an increase in the concentration of •OH radicals. This cause to decolorization congo dye in textile industry wastewater. After a certain dose of cellulose/ SnO2 nanocomposite concentration, the treated textile wastewater becomes turbid and thus inhibits the penetration of sun light radiation necessary for photocatalysis.
cellulose/ SnO2 nanocomposite concentration (mg/l) | Congo red decolorization yields(%) |
0,5 | 78 |
1 | 86 |
1.5 | 99 |
2 | 98 |
2,5 | 99 |
3 | 98 |
3,5 | 74 |
4 | 63 |
Table 2: Effect of cellulose/ SnO2 nanocomposite concentration on congo dye photodegradation yield.
Effect of pH on congo dye photodegradation yield
The variation of pH of the surface of cellulose/ SnO2 nanocomposite charge of nanocomposite and provides the photocatalytic reactions. Under acidic or alkaline condition the surface of cellulose/ SnO2 nanocomposite can be protonated or deprotonated. The cellulose/ SnO2 nanocomposite surface charged positively in acidic medium and negatively charged in alkaline medium. It was known that cellulose/ SnO2 nanocomposite have higher oxidizing activity at lower pH, but excess H+ can lowered the photodegradation efficiency. The maximal photodegradation yield was detected at pH=5 as 99% (Table 3). The anionic dye exhibited strong Lewis base and can easily adsorb on the positively charged cellulose/ SnO2 nanocomposite surface. This elevated the adsorption and photodegradation of the congo dye under acidic conditions. The congo dye was not adsorbed on nanocomposite surface under alkaline conditions due to competitive photodegradation by OH radicals. On the other hand, the surface of the cellulose/ SnO2 nanocomposite is positively charged below isoelectric point and carries a negative charge above it. The Photodegradation of congo dye was found to be maximum at 5pH because congo dye is the cationic and adsorbed and photodegraded easily on the surface of nanocomposite.
pH | Congo red decolorization yields(%) |
3 | 78 |
4 | 86 |
5 | 99 |
7 | 67 |
8 | 40 |
10 | 25 |
Table 3: Effect of pH on congo dye photodegradation yield.
The extent of dye adsorption depends on the initial dye concentration, nature of the dye, surface area of photocatalyst and pH of the solution. The pH determines the surface charge of the photocatalyst.
Effect of temperature on the photodegradation yield of congo red dye
An increase in temperature during photodegradation ending with elevated photodegradation yields however temperature >60°C inhibits the charge carriers between valence band and conduction band and the photodegradation efficiencies can be lowered. In this study the maximal photodegradation yield for congo dye was detected at 40 oC ( Table 4) . A temperature below 60°C favors the photodegradation yields ending an increase in the activation of OH radicals .The temperature range between 20-50°C was found to be favorable for ultimate photodegradation. At elevated temperatures, the photodegradation yields increased while at lowest temperatures the photodegradation yields decreased.
Temperature (oC) | Congo red decolorization yields(%) |
10 | 78 |
20 | 83 |
30 | 93 |
40 | 99 |
50 | 90 |
60 | 65 |
70 | 50 |
Table 4: Effect of temperature on congo dye photodegradation yield
Effects of some anions (NaCl, KNO3 and NaHCO3) on the photodegradation yield of congo dye
In order to detect the effects of some anions on photodegradation of congo dye, trace concentrations of NaCl, KNO3 and NaHCO3 were added. At low ion concentrations, the congo red photodegradation yields did not varied. After 0.2 mg/l ion concentration the congo dye yield decreased to 80%. High ion concentrations decrease the colloidal stability, increases the mass transfer and decrease the surface contact between congo red and the nanocomposite. A fouling problem in the nanocomposite surface inhibits the OH radical generations.
NaCl concentration (mg/l) | KNO3 concentration (mg/l) | NHCO3l concentration (mg/l) | Congo red decolorization yields (%) |
0,05 | 0,05 | 0,05 | 99 |
0,07 | 0,07 | 0,07 | 98 |
0,1 | 0,1 | 0,1 | 90 |
0,2 | 0,2 | 0,2 | 80 |
0,3 | 0,3 | 0,3 | 67 |
0,4 | 0,4 | 0,4 | 50 |
2 | 2 | 2 | 35 |
Table 5: Effect of some ions on congo dye photodegradation yield.
Effects of light power on the photodegradation yield of congo dye
Although the photodegradation yield increased with increase in light intensity, elevated sun light power did not affect significantly the color removal efficiency. In this study the maximum congo red removals was detected at a light power of 40 W/m2 (Table 6). At low light intensity due to increasing of electron–hole formation the electron–hole recombination increased resulting in increasing of photodegradation yields. When light intensity is increased to 50 and 60 W/m2, the electron–hole pair separation competes and a non-significant effect was detected for photodegradation yields of congo dye.
Light power (W/m2) | Congo red decolorization yields (%) |
20 | 79 |
30 | 90 |
40 | 99 |
50 | 98 |
60 | 98 |
Table 6: Effect Light power on congo dye photodegradation yield.
Effect of photodegradation time on congo dye photodegradation yield
In this study the maximum congo dye photodegradation yield was detected after 30 min irradiation time (Table 7). The photodegradation yield decreases at high irradiation times since a competition was observed between the reactant and the intermediate products. The slow dye photodegradation after 30 min is due to the reaction of intermediates of dye and OH radicals. As a result, long photodegradation times decrease the activation of dye molecules.
Photodegradation time (min) | Congo red decolorization yields (%) |
20 | 79 |
30 | 90 |
40 | 99 |
50 | 80 |
60 | 70 |
Table 7: Effect of photodegradation time on congo dye photodegradation yield.
Effect of dissolved oxygen on congo dye photodegradation yield
In order to detect the effect of dissolved oxygen on the congo dye decolorization yields the dissolved oxygen concentrations were increased from 1 up to 5 mg/l. The photodegradation yields for congo dye were measured maximal at 3 mg/l dissolved oxygen concentrations (Table 8). Further increase od dissolve oxygen dose did not affect significantly the photodegradation yields. Dissolved oxygen is used as an electron acceptor during photodegradation for activated conduction band electron from redox reactions. A certain amount of dissolved oxygen stabilize of radical intermediates Furthermore can cleave the aromatic rings in dye molecule.
Dissolved oxygen concentration (mg/l) | Congo red decolorization yields (%) |
1 | 70 |
2 | 82 |
3 | 99 |
4 | 99 |
5 | 99 |
Table 8: Effect of dissolved oxygen on congo dye photodegradation yield.
Conclusions
The present study assess the photocatalytic performance of the cellulose/ SnO2 nanocomposite versus congo dye present in textile industry wastewaters. The effect of pH, nanocomposite dosage, initial conge dye concentration, photodegradation time, temperature and sun light power on the photodegradation of congo dye was examined. A maximum congo dye photodegradation of 99% could be attained at the optimum pH of 5, cellulose/ SnO2 nanocomposite dose of 1.5 mg/l, congo dye concentration of 400 mg/l, a light intensity of 40 W/m2, a photodegradation time of 40 min , 3 mg/l dissolved oxygen concentration and NaCl, KNO3 and NaHCO3 concentrations of 0,05 mg/l. The present study suggests that the prepared cellulose/ SnO2 nanocomposite could prove to be a viable photocatalyst for the treatment of dye-contaminated textile wastewaters.
References
- Costantino, F.; Armirotti, A.; Carzino, R.; Gavioli, L.; Athanassiou, A.; et al. (2020). In Situ Formation of SnO2 Nanoparticles on Cellulose Acetate Fibrous Membranes for the Photocatalytic Degradation of Organic Dyes. Journal of Photochemistry and Photobiology A: Chemistry, 398, 112599.
View at Publisher | View at Google Scholar - Hon, N.-S. (1977). Photodegradation of Cellulose Acetate Fibers. Journal of Polymer Science: Polymer Chemistry Edition, 15 (3), 725–744.
View at Publisher | View at Google Scholar - Bayer, I. S.; Fragouli, D.; Attanasio, A.; Sorce, B.; Bertoni, G.; et al. (2011). Water-Repellent Cellulose Fiber Networks with Multifunctional Properties. ACS Appl. Mater. Interfaces, 3 (10), 4024–4031.
View at Publisher | View at Google Scholar - Al-Hamdi, A. M.; Rinner, U.; Sillanpää, M. (2017). Tin Dioxide as a Photocatalyst for Water Treatment: A Review. Process Safety and Environmental Protection, 107, 190–205.
View at Publisher | View at Google Scholar - Dimitrov, M.; Guncheva, M.; Zhiryakova, D.; Lazarova, Tz.; Lalev, G.; et al. (2014). Nanostructured Tin Dioxide – a Promising Multipurpose Support Material for Catalytic and Biocatalytic Applications. Chemical Engineering Journal, 252, 55–63.
View at Publisher | View at Google Scholar - Mahana, S.; Sapkota, P.; Ghosh, S.; Manju, U.; Topwal, D. Structural and Electronic Phase Evolution of Tin Dioxide.
View at Publisher | View at Google Scholar - Xia, X.; Dong, X. J.; Wei, Q. F.; Cai, Y. B.; Lu, K. Y. (2012). Formation Mechanism of Porous Hollow SnO2 Nanofibers Prepared by One-Step Electrospinning. Express Polym. Lett., 6 (2), 169–176.
View at Publisher | View at Google Scholar - Chang, C.-H.; Rufner, J. F.; Benthem, K. van; Castro, R. H. R. (2013). Design of Desintering in Tin Dioxide Nanoparticles. Chem. Mater., 25 (21), 4262– 4268.
View at Publisher | View at Google Scholar - Toupance, T.; El Hamzaoui, H.; Jousseaume, B.; Riague, H.; Saadeddin, I.; et al. (2006). Bridged Polystannoxane: A New Route toward Nanoporous Tin Dioxide. Chem. Mater, 18 (26), 6364–6372.
View at Publisher | View at Google Scholar - Wang, N.; Xu, J.; Guan, L. (2011). Synthesis and Enhanced Photocatalytic Activity of Tin Oxide Nanoparticles Coated on Multi-Walled Carbon Nanotube. Materials Research Bulletin, 46 (9), 1372–1376.
View at Publisher | View at Google Scholar - Agarwal, U. P. (2019). Analysis of Cellulose and Lignocellulose Materials by Raman Spectroscopy: A Review of the Current Status. Molecules, 24 (9), 1659.
View at Publisher | View at Google Scholar - Epifani, M.; Tang, P.-Y.; Genç, A.; Morante, J. R.; Arbiol, J.; et al. (2016). The Ethylhexanoate Route to Metal Oxide Nanocrystals: Synthesis of CoO Nanooctahedra from CoII2-Ethylhexanoate. European Journal of Inorganic Chemistry 2016, (24), 3963–3968.
View at Publisher | View at Google Scholar - Epifani, M.; Arbiol, J.; Díaz, R.; Perálvarez, M. J.; Siciliano, P.; et al. (2005). Synthesis of SnO2and ZnO Colloidal Nanocrystals from the Decomposition of Tin (II) 2-Ethylhexanoate and Zinc (II) 2-Ethylhexanoate. Chemistry of Materials, 17 (25), 6468–6472.
View at Publisher | View at Google Scholar - Zhu, H. J.; Hill, R. H. (2002). The Photochemical Metal Organic Deposition of Manganese Oxide Films from Films of Manganese(II) 2-Ethylhexanoate: A Mechanistic Study. Journal of Non-Crystalline Solids, 311 (2), 174–184.
View at Publisher | View at Google Scholar - Bronstein, L. M.; Huang, X.; Retrum, J.; Schmucker, A.; Pink, M.; et al. (2007). Influence of Iron Oleate Complex Structure on Iron Oxide Nanoparticle Formation. Chemistry of Materials, 19 (15), 3624–3632.
View at Publisher | View at Google Scholar - Kim, T. W.; Kwak, J. K.; Park, K. H.; Yun, D. Y.; Lee, D. U.; et al. (2010). Microstrucural and Optical Properties of SnO2 Nanoparticles Formed by Using a Solvothermal Synthesis Method. Journal of the Korean Physical Society, 57 (6(1)), 1803–1806.
View at Publisher | View at Google Scholar - Hanyš, P.; Janeček, P.; Matolı´n, V.; Korotcenkov, G.; Nehasil, V. (2006). XPS and TPD Study of Rh/SnO2 System – Reversible Process of Substrate Oxidation and Reduction. Surface Science, 600 (18), 4233–4238.
View at Publisher | View at Google Scholar
