

Review Article | DOI: https://doi.org/10.31579/2835-9291/018
Noncoding Rnas and Macrophage Differentiation in Metabolic Diseases, Atherosclerosis, and Cancer
- Paul Holvoet *
Experimental Cardiology, KU Leuven, Leuven, Belgium.
*Corresponding Author: Paul Holvoet, Experimental Cardiology, KU Leuven, Leuven, Belgium.
Citation: Paul Holvoet, (2024), Noncoding Rnas and Macrophage Differentiation in Metabolic Diseases, Atherosclerosis, and Cancer, International Journal of Clinical Case Studies,3(2); DOI:10.31579/2835-9291/018
Copyright: © 2024, Paul Holvoet. This is an open-access article distributed under the terms of the Creative Commons Attribution License, which permits unrestricted use, distribution, and reproduction in any medium, provided the original author and source are credited.
Received: 06 April 2024 | Accepted: 18 April 2024 | Published: 27 April 2024
Keywords: metabolic; obesity; type 2 diabetes; non-alcoholic fatty liver disease; atherosclerosis; cancer; noncoding RNA; regulation
Abstract
Increased infiltration of monocytes in white adipose tissue, pancreas, liver, and arteries is the initial step in the pathogenesis of metabolic diseases, obesity, type 2 diabetes, non-alcoholic fatty liver diseases, and atherosclerosis. They tend to differentiate into M1 macrophages, associated with mitochondrial and endoplasmic reticulum oxidative stress, insulin resistance, and inflammation. Furthermore, many studies link metabolic diseases to an increased risk of several cancer types. However, tumor-associated macrophages are predominantly M2. Of interest, a cluster consisting of miR-17, miR-27a, miR-29a, miR-34a, miR-125b, miR-130b, miR-140, miR-155, and miR-222 tend to be overexpressed in cardiometabolic tissues, inducing M1 macrophage polarization and immune-mediated cell death. In contrast, they tend to be suppressed in tumors associated with M2 macrophage polarization and immunosuppression. Often LPS, inflammatory cytokines, leukotrienes, C-reactive protein, glucose, and oxidized LDL tend to upregulate these noncoding RNAs in metabolic and vascular tissues, while hypoxia, MYC, IFN-γ, TGF-β, and lactate tend to downregulate them in tumors. However, a consistent study of the regulation of the proposed cluster related to stages in disease development is lacking.
Introduction
Metabolic diseases, obesity, type 2 diabetes, and non-alcoholic fatty liver diseases (NAFLD) are associated with increased infiltration in white adipose tissue, pancreas, or liver of monocytes which differentiate into macrophages. The balance between pro- and anti-inflammatory regulators of macrophages resulting in M2 to M1 polarization depends on oxidative stress, insulin resistance, and inflammation depend on the balance between pro- and anti-inflammatory regulators of macrophages resulting in M2 to M1 polarization (Gordon & Martinez, 2010; Loomba, Friedman, & Shulman, 2021; Thomas & Apovian, 2017). M1 macrophages, induced by interferon (IFN)-γ, tumor necrosis factor (TNF)-α, and toll-like receptor (TLR) ligands, produce proinflammatory cytokines like interleukin (IL)-1β, IL-6, and IL-12, and TNF-α, and high levels of reactive oxygen species (ROS) and nitrogen species (Gordon, 2003). On the other hand, IL-4, IL-10, IL-13, and immune complexes activate M2 macrophages, which secrete anti-inflammatory cytokines like IL-10, C-C motif chemokine ligand (CCL)-18 and CCL22 (Sica & Mantovani, 2012). In addition, they express the mannose receptor CD206 (or MRC1), the scavenging receptor CD163, and dendritic cell-specific intercellular adhesion molecule-3-grabbing non-integrin (DC-SIGN) (Martinez, Helming, & Gordon, 2009). Generally, nuclear factor kappa B (NF-κB), interferon regulatory factor (IRF), and signal transducer and activator of transcription (STAT)-1 activate M1 macrophages. In contrast, STAT3 and STAT6 activate M2 macrophages. However, NF-κB induces p62, limiting the NOD-like receptor family pyrin domain containing 3 (NLRP3)-inflammasome activation (Z. Zhong et al., 2016). Herein, STAT6 coordinates with peroxisome proliferator-activated receptor (PPAR)-γ and PPAR-δ, Krüppel-like factor 4 (KLF4), KLF2, and MYC to induce M2 genes and inhibit NF-κB/ hypoxia-inducible factor 1, alpha (HIF-1α) signaling and expression of M1 genes. Although TLR induction leads to NF-κB activation and the production of inflammatory molecules by M1 macrophages, NF-κB activation also activates a genetic program essential for resolving inflammation. Moreover, the induction of p50 NF-κB homodimers is essential for M2 polarization (Sica & Mantovani, 2012). However, one must be aware that these two macrophage phenotypes are extremes of a continuum of functional states (Genin, Clement, Fattaccioli, Raes, & Michiels, 2015; Mantovani, Sozzani, Locati, Allavena, & Sica, 2002).
In addition, M2 cells depend on oxidative phosphorylation (OXPHOS) for their energy production (Viola, Munari, Sanchez-Rodriguez, Scolaro, & Castegna, 2019). On the contrary, HIF-1α, AMP-activated protein kinase (AMPK), and NF-κB favor glycolysis and inhibit oxidative phosphorylation (OXPHOS) in M1 macrophages, associated with increased production of reactive oxygen species (ROS).
In addition, the phosphatidylinositol-4,5-bisphosphate 3-kinase (PI3K)/ AKT serine/threonine kinase (AKT) pathway is a bridge between metabolic control, insulin signaling, and inflammation. Indeed, PI3K/AKT is critical in restricting proinflammatory and promoting anti-inflammatory responses in macrophages by negatively regulating TLR and NF-kB signaling. The transforming growth factor (TGF)-β and IL-10 promote M2 polarization via PI3K/Akt signaling. Furthermore, a crosstalk between the STAT6 and PI3K activation is required for IL-4–induced M2 macrophage activation (Vergadi, Ieronymaki, Lyroni, Vaporidi, & Tsatsanis, 2017). Nevertheless, several AKT isoforms have different effects on macrophage polarization, with AKT1 ablation giving rise to an M1 and AKT2 ablation resulting in an M2 phenotype (Arranz et al., 2012).
Many studies link metabolic diseases with the risk of atherosclerosis. Overall, diseased vascular cells are also characterized by oxidative stress, inflammation, insulin resistance, and a shift from M2 to M1 macrophages (Ginckels & Holvoet, 2022).
In addition, many studies also link metabolic diseases to an increased risk of developing several cancer types (Faulds & Dahlman-Wright, 2012). Above, we discussed how inflammatory cytokines contribute to the development of low-grade systemic inflammation and aberrant NLRP3 activation, driving chronic inflammatory state and eventually leading to cell death. However, while inflammatory cytokines and NLRP3 inflammation are detrimental to the pathogenesis of metabolic diseases, they may play a beneficial role in some cancers (B. R. Sharma & Kanneganti, 2021). As in metabolic tissues, tumor-associated macrophages (TAMs) derive from circulating monocytes recruited by chemokines (CCL-2, CCL-3, CCL-4, CCL-5, CCL-7, CCL-8, CXCL-12) and cytokines (VEGF, platelet-derived growth factor, colony-stimulating factor 1, and IL-10) (Erin, Grahovac, Brozovic, & Efferth, 2020). However, hypoxia polarizes macrophages toward an M2 phenotype through TGF-β (Guo et al., 2016). In addition, IL-4, IL-6, IL-8, IL-10, IL-11, IL-17, IL-18, IL-33, NF-κB, GM-CSF, and TNF-α induce M2 TAM polarization (Cho et al., 2018). M2-type TAMs promote and support the occurrence and development of tumors, while M1-type TAMs inhibit tumor growth. In addition, NF-κB activation is crucial in activating tumor-associated macrophages (TAMs). They first exist in the form of undifferentiated macrophages M0, which again can be polarized into M1 macrophages by bacterial components, IFN-γ, LPS, TLR, or M2a macrophages by IL-4 and IL-13, M2b macrophages by TLR, M2c macrophages by glucocorticoid, and M2d macrophages by IL-6. M1 macrophages are anti-oncogenic, releasing proinflammatory cytokines IL-1β and IL-12 and cytotoxic ROS and TNF (Y. Li et al., 2022). In contrast, M2 TAMS secrete IL-6 and chemokine (C-X-C motif) ligand (CXCL)-8 with an immunosuppressive action.
Our goal was to perform an unbiased literature search of noncoding RNAs controlling the polarization of macrophages. More specifically, we searched noncoding RNAs inducing similar effects in metabolic tissues and vascular tissues while searching noncoding RNAs showing contrasting up- or downregulation in metabolic tissues such as adipose tissues, pancreas, and liver, compared to tumors, thus favoring M1 macrophages in cardiometabolic tissues and M2 macrophages in tumors. We have chosen noncoding RNAs because they can respond to stress conditions rapidly, and a change in their expression is reversible in contrast to inherited genome mutations (Costantino et al., 2018; Holvoet, 2012).
Macrophages in inflammation, oxidative stress and insulin resistance in obese white adipose tissue
Adipocytes in obese white adipose tissue secrete proinflammatory proteins such as leptin, resistin, TNF-α, and IL-6. In contrast, anti-inflammatory adiponectin levels are low (Engin, 2017). This adipokine imbalance contributes to the proinflammatory state characteristic of obesity and obesity-related complications (Fuster, Ouchi, Gokce, & Walsh, 2016). (Figure 1)
While leptin increases in obesity, the expression of leptin receptors (LepRs) decreases, leading to leptin resistance. In addition, leptin activates the Janus kinase (JAK)-2- STAT3 pathway (Banks, Davis, Bates, & Myers, 2000). STAT3 activates SOCS3, which inhibits leptin-induced signals (Bjorbaek, Elmquist, Frantz, Shoelson, & Flier, 1998). In addition, SOCS3 binds to insulin receptor substrates (IRS)-1 and IRS-2, leading to their ubiquitination, degradation, and insulin resistance (Ueki, Kondo, & Kahn, 2004). Leptin also increases local expression of TNF-α, further impairing insulin sensitivity by downregulating the tyrosine kinase activity of insulin receptors (IRs) and decreasing the expression of glucose transporter (GLUT)-4 (Abel et al., 2001; Shepherd & Kahn, 1999). Furthermore, reduced insulin signaling impairs the PI3K/AKT/ mechanistic target of the rapamycin kinase (mTOR) pathway, hampering M2 macrophage differentiation (M. Shen et al., 2022).
In addition, the sustained exposure to leptin and activation of the JAK-STAT1 pathway inhibits the expression of PPAR-γ, which is required for adipogenesis and preventing M1 macrophage differentiation (Y. Han et al., 2022; Rhee, Sung, Jung, & Cheon, 2008). STAT1 activation, reinforced by IFN-γ, promotes M1-like macrophages. The shift of M2 to M1 macrophages decreases IL-4 and IL-13, inactivating the JAK−STAT6 pathway and IL-10, thereby inactivating JAK−STAT3, preventing M2 macrophage polarization (Levy & Darnell, 2002). Furthermore, the decrease of IL-4 and IL-13 impairs PPAR-γ. In addition, IL‐1β-induced IL-20 stimulates the differentiation of monocytes into M1 macrophages, upregulating netrin one, leptin, and monocyte chemotactic protein 1 (MCP-1) in adipocytes, and TNF-α, MCP-1, and netrin one and its receptor in macrophages (Hsu et al., 2021). M1 macrophages, also induced by IFN-γ, produce proinflammatory cytokines like IL-1β, IL-6 and IL-12, and TNF-α.
In addition, HIF-1α, AMPK, and NF-κB favor glycolysis and inhibit OXPHOS in M1 macrophages, producing high levels of ROS (Gordon, 2003). Furthermore, the elevated adipose tissue mass in obesity liberates large amounts of free fatty acids (FFAs) into the bloodstream, contributing to insulin resistance by reducing insulin signaling, shifting mitochondrial oxidation from glucose to FFAs, and diminishing the insulin secretory response to glucose of islet β cells (Fuentes, Roszer, & Ricote, 2010). Although one usually only considers M1 and M2 macrophages, multiple macrophage populations appear in adipose tissue along the M2 to M1 continuum. In addition, they appear to utilize both glycolysis and OXPHOS in obesity (Caslin, Bhanot, Bolus, & Hasty, 2020). In addition, the transfer of mitochondria from adipocytes to macrophages results in higher mitochondrial mass, lower mitochondrial membrane potential, and elevated mitochondrial ROS (Brestoff et al., 2021).
Finally, the increased infiltration of monocytes in white adipose tissue may add to obesity. Indeed, increased CCL2 (or monocyte chemoattractant protein-1, MCP-1) in obese mice was associated with increased adipose tissue mass (Kanda et al., 2006). In contrast, exosomes from adipose-derived stem cells could polarize macrophages to an anti-inflammatory phenotype via upregulating the expression of NF-E2-like basic leucine zipper transcriptional activator (NRF2). NRF2 restores the antioxidant activity of superoxide dismutase (SOD) and catalase (CAT), upregulating heme oxygenase (HO)-1 and NAD(P)H quinone dehydrogenase 1 (NQO1), thereby alleviating LPS-induced accumulation of ROS, and inhibiting nuclear translocation of NF-κB p65 and inflammation (Di Francesco et al., 2020).
In contrast to leptin, adiponectin secretion, and circulating adiponectin levels are inversely proportional to body fat content. Advanced glycation end products (AGEs) and TNF-α in obesity impair sirtuin (SIRT)-1, forkhead box O1 (FOXO1), and PPAR coactivator 1α (PGC-1α) and, in turn, suppress adiponectin production and downregulate the adiponectin receptor (ADIPOR1/R2) (Whitehead, Richards, Hickman, Macdonald, & Prins, 2006). In addition, low adiponectin hampers VEGF-A expression through adiponectin receptors, PI3K/AKT/mTOR, and HIF-1α signaling cascades (Lee et al., 2015). Low adiponectin may also lead to mitochondrial dysfunction associated with a decrease of the mitochondrial antioxidant enzyme cytochrome oxidase 1 (MTCOI or COX1) and of PGC-1α and OXPHOS impairing fatty acid oxidation and inducing ROS generation and inflammation even when insulin sensitivity is retained (Hulsmans, Van Dooren, Mathieu, & Holvoet, 2012). (Figure 1)
Role of noncoding RNA in macrophage polarization, inflammation, and insulin resistance in obese whit
MiR-141-3p improves AKT phosphorylation and enhances insulin signal transduction (Dang et al., 2019). Let-7 represses the CREB-regulated transcription coactivator (mTORC1), causing insulin resistance with increased NLRP3 inflammasome activation (Dubinsky et al., 2014). In addition, increased expression of miR-17 (Heneghan, Miller, McAnena, O'Brien, & Kerin, 2011), miR-103 (Z. Zhang et al., 2019), miR-143-145 cluster, miR-155 (Y. Zhang et al., 2016), miR-221-222 (Peng, Zhou, et al., 2017), and miR-377 (Peng, Wu, et al., 2017) are associated with obesity-associated insulin resistance and inflammation. However, the ADP-ribosylation factor 3 circular RNA (circARF3) acts as an endogenous miR-103 sponge, restraining the NF-κB-signaling pathway and suppressing NLRP3 inflammasome activation (Z. Zhang et al., 2019). In addition, microRNA-181b improves insulin sensitivity by improving endothelial cell function in white adipose tissue (X. Sun et al., 2016). However, microRNA-181b is low in obese adipose tissue. (Figure 1)
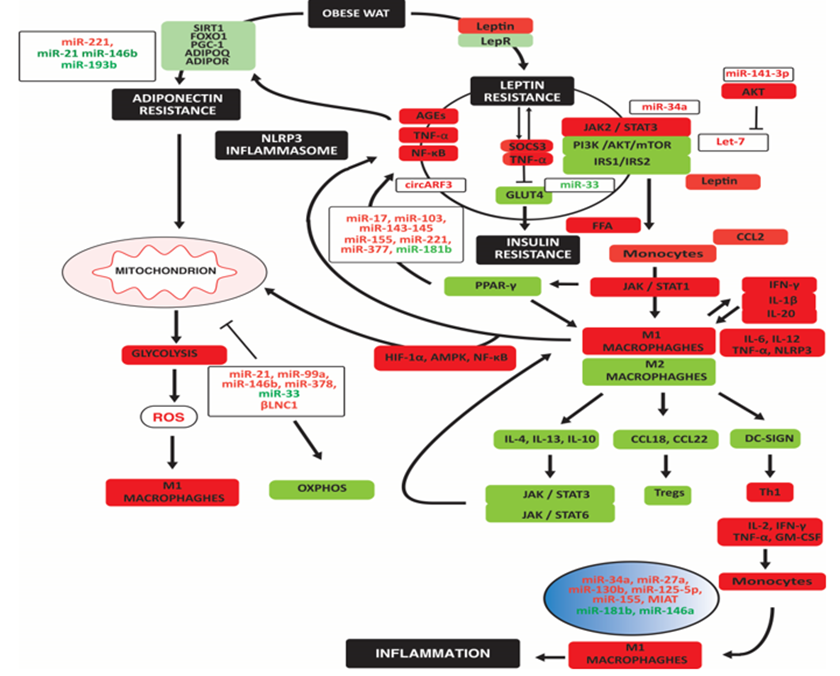
Noncoding RNAs may indirectly affect macrophage polarization by causing leptin, adiponectin, insulin resistance, mitochondrial dysfunction and oxidative stress, and differentiation of T cells. High miR-34a, miR-27a, miR-130b, miR-125-5p, miR-155, and lncRNA MIAT directly induced M1 macrophage polarization. The decrease of miR-146a and miR-181b reinforces M1 macrophage polarization. Upregulated noncoding RNAs are in red; downregulated noncoding RNAs are in green. Arrowheads indicate activation; hammerheads indicate inhibition.
Several miRs are associated with M1 macrophage polarization and adipose tissue inflammation: adipocyte exosomal miR-34a by repressing KLF4 and by regulating CXCL10 and CXCL11, activating JAK-STAT signaling; miR-27a and miR-130b by repressing PPAR-γ and activating NF-κB; miR-125b-5p by activating NF-κB; and miR-155 by targeting arginase-2 which in mitochondria is crucial for OXPHOS and IL-10-mediated downregulation of inflammatory succinate, HIF-1α, and IL-1β (Dowling et al., 2021). However, the X inactive specific transcript (XIST) may sponge miR-125b (Luo et al., 2022). In addition, the myocardial infarction-associated transcript (MIAT or GOMAFU) reduced M2 polarization in macrophages and induced endoplasmic reticulum (ER) stress and inflammation in mice (Y. B. Han et al., 2020). In contrast, miR-181b represses vascular cell adhesion molecule (VCAM-1), inhibiting STAT1 and Pleckstrin homology domain leucine-rich repeat protein phosphatase, dephosphorylating AKT, and reducing TNF α levels, while miR-146a decreased IL-1β levels (Y. Zhang et al., 2015). However, as miR-181b, miR-146a is decreased in obese adipose tissue.
Leptin-induced miR-221 downregulates the adiponectin receptor one and impairs adiponectin action (Meerson et al., 2013). Low miR-21 decreases adiponectin mRNA and protein [removed]Kang et al., 2013), while low miR-193b is associated with decreased adiponectin and regulators (Belarbi et al., 2015). A decrease of miR-146b-5p in monocytes reduces adiponectin's anti-inflammatory but not insulin-signaling action, increasing mitochondrial ROS (Hulsmans, Van Dooren, et al., 2012).
IL-4 induced miR-21, miR-99a, miR-146b, and miR-378 in exosomes while reducing miR-33, improving mitochondrial function and OXPHOS, enhancing insulin-dependent glucose uptake through PPAR-γ-driven expression of GLUT4 (Phu, Ng, Vu, Bouchareychas, & Raffai, 2022). In addition, the lncRNA βLNC1 is crucial for retaining mitochondrial function by stimulating the transcription of PGC-1β (Tang et al., 2020). (Figure 1)
Macrophages in inflammation, oxidative stress, and insulin resistance in type 2 diabetes
The binding of insulin to IRs in cell membranes leads to the phosphorylation and activation of several IRS proteins. Phosphorylated IRS proteins interact with PI3K, leading to its activation and transfer to the plasma membrane. Especially the phosphatase and tensin homolog (PTEN) and SOCS family regulate PI3K (Chang, Chiang, & Saltiel, 2004; Maehama & Dixon, 1999). PI3K is essential in GLUT4 translocation and glucose uptake (Martin, Slot, & James, 1999; P. M. Sharma et al., 1998). However, excess nutrients such as amino acids and glucose overstimulate mTORC1, downregulating insulin signaling (Huo et al., 2014; Tsunekawa et al., 2011). Additionally, the decrease of the mTORC2 complex results in impaired phosphorylation of AKT and translocalization of GLUT4 to the plasma membrane, decreasing glucose transport (Kohn, Summers, Birnbaum, & Roth, 1996). The increase of mTORC1 over mTORC2 in type 2 diabetes compromises cellular defense systems such as SIRTs and NQO1 (Houtkooper, Pirinen, & Auwerx, 2012). In addition, the decrease in SIRT1 impairs glucose-stimulated insulin secretion (GSIS) in pancreatic β cells (Imai & Kiess, 2009). Furthermore, impaired AKT phosphorylation and decreased SIRT impair FOXOs induction of antioxidant proteins: Mn-SOD (SOD-2), Cu, Zn-SOD (SOD-1), peroxiredoxin-3, PRX3, and PRX5), glutathione peroxidase-1 (GPX-1), and mitochondrial thioredoxin (TRX2) and mitochondrial thioredoxin reductase (TRXR2) (H. Ren et al., 2020). This decrease in antioxidant proteins increases ROS and decreases protection by autophagy. (Figure 2)
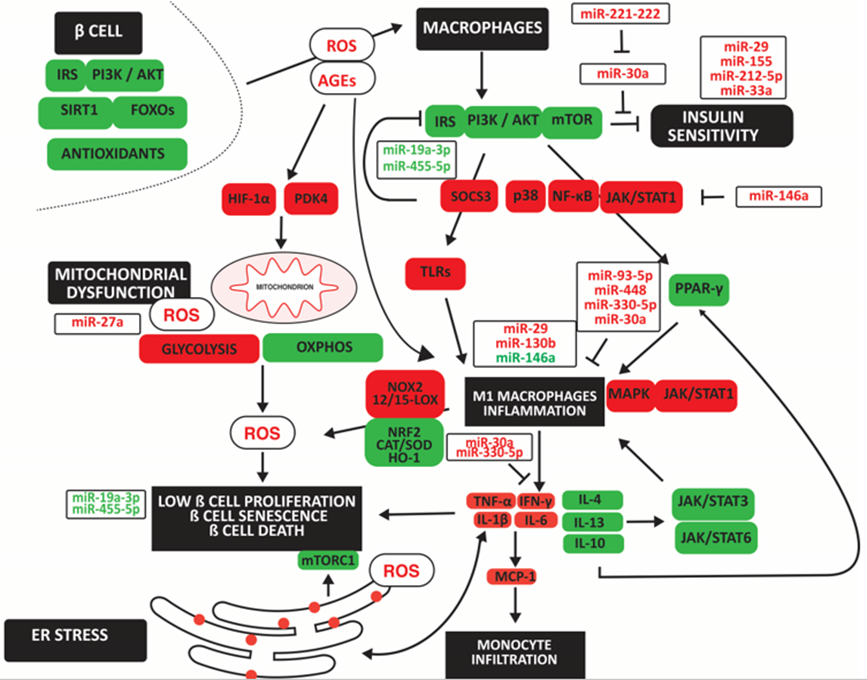
Noncoding RNAs may indirectly affect macrophage polarization by causing insulin resistance and mitochondrial and ER dysfunction with oxidative stress. The upregulation of mir-29 and miR-130b and the downregulation of miR-146a directly induced M1 macrophage polarization. In contrast, upregulated miR-30a, miR-93p, miR-330-5p and miR-448 inhibited M1 macropahge polarization. Upregulated noncoding RNAs are in red; downregulated noncoding RNAs are in green. Arrowheads indicate activation; hammerheads indicate inhibition.
Increased ROS inhibits the IRS/PI3K/AKT/mTOR pathway. It impairs PPAR-γ signaling pathways and its anti-inflammatory effect by inhibiting the glucose-induced activation of p38, NF-κB, and STAT1, resulting in reduced expression of PPAR-γ target genes, CD36, and ATP binding cassette subfamily G member 1 (ABCG1), in M2 macrophages. In addition, impaired IRS2-mediated PI3K activity in macrophages induces resistance to IL-4 in association with overexpression of SOCS3 (Yu et al., 2019). SOCS3 increases toll-like receptor (TLR4)-mediated M1 macrophage polarization and β cell apoptosis (Cucak et al., 2014). In addition, TLR-2 and TLR-7/9 activate M1 macrophages and inflammation with increased TNF-α, IL-1β, IL-6, IFN-γ, and ROS, favoring M1 macrophage differentiation (Rendra et al., 2019). In addition, low IL-13 anti-inflammatory function in type 2 diabetes increases monocyte- and macrophage-derived inflammatory cytokines causing β cell death (Rutti et al., 2016). Furthermore, advanced glycation end products (AGEs) induced M1 polarization through the HIF-1α/ pyruvate dehydrogenase kinase 4 (PDK4) axis, indicating a shift to anaerobic glycolysis (X. Han, Ma, Zhu, Sun, & Liu, 2020). Increased oxidative stress is also due to decreased NRF2 and increased NOX2 expression, resulting in low levels of the antioxidants SOD and CAT in M1 macrophages and loss of protection against inflammation in a diabetic background (Lazaro et al., 2018). The decrease in NRF2 may be due to increased arachidonate 15-lipoxygenase (15-LOX) and 12-LOX, increasing ROS, the proportion of anti-inflammatory macrophages, and loss of β cell mass in a diabetic mouse model (Hernandez-Perez et al., 2017). Furthermore, a decrease in the antioxidant HO-1, inhibiting KLF4, CD163, and CD206, promotes M1 macrophage differentiation (Husseini et al., 2015).
The sarcoendoplasmic reticulum Ca (2+) ATPase 2b (SERCA2b) pump maintains a steep Ca (2+) concentration gradient between the cytosol and ER lumen in the pancreatic β cell, required for maintaining insulin production and secretion, maintenance of ER function and β cell survival. However, IL-1β activates AMPK and induces inducible nitric oxide synthase (iNOS), increasing NO, and decreasing SERCA2b mRNA and protein expression, leading to ER stress and β cell death (Araki, Oyadomari, & Mori, 2003). In addition, ER stress inhibits mTORC1, impairing β cell expansion (Riahi et al., 2018). (Figure 2)
Role of noncoding RNA in macrophage polarization, inflammation, and insulin resistance in type 2 dia
MiR-30a blocks inflammatory IL-1β in immune cells, islet cells, and IFN-γ in inflammatory cells, thereby retaining insulin sensitivity (Koh et al., 2018). However, miR-29 and miR-221 are associated with insulin resistance and inflammation, the latter by counteracting the action of miR-30a, increasing M1 macrophage polarization, inflammation, and insulin resistance (F. Bao, Slusher, Whitehurst, & Huang, 2018; Y. Sun et al., 2021). MiR-155 enriched in exosomes released by obese adipocytes block PPARγ and insulin sensitivity (W. Ying et al., 2017). M1-polarised macrophages secrete exosomes enriched in miR-212-5p, impairing insulin secretion and sensitivity by targeting the SIRT2 gene and regulating the Akt/GSK-3β/β-catenin pathway (Qian et al., 2021). MiR-33a impairs ABCA1 expression in pancreatic islets, thereby increasing lipid deposition and insulin resistance (Wijesekara et al., 2012). Reducing miR-19a 3p and miR-455 in type 2 diabetes increases SOCS3 [removed]P. Chen et al., 2019; Y. Li, Luo, Wang, Wu, & Guo, 2016). miR-27a increases mitochondrial ROS by reducing levels of NRF2, and GPX1 (Ebrahimpour, Shahidi, Abbasi, Tavakoli, & Esmaeili, 2020).
MiR-29 recruits’ monocytes and activates them to macrophages (Y. Sun et al., 2021). MiR-130b promoted M1 macrophage polarization by targeting PPAR-γ (M. Zhang, Zhou, Wang, & Li, 2016). MiR-146a-5p inhibited tumor necrosis factor receptor-associated factor-6 (TRAF6)/ STAT1 signaling pathway, promoting M2 macrophage polarization (Y. Zhang et al., 2022). However, high glucose-induced lncRNA HLA complex group 18 (HCG18) targeted miR-146a, increasing TNF receptor-associated factor 6 (TRAF6) expression and inflammatory TNF-α, IL-1β, and IL-6 levels (W. Ren et al., 2021). In contrast, exosomal miR-93-5p and miR-448 inhibited TLR4 [removed]Z. Wang, Sun, Li, & Liu, 2022; Q. Zhao, Wang, Hu, Zhang, & Yin, 2019). TLR2/6- and TLR4-activated macrophages reduced insulin secretion partly via reducing INS1, INS2, and PDX (Nackiewicz et al., 2014). MiR-330-5p directly upregulated the inhibitory receptor T cell immunoglobulin and mucin domain–containing-3 (TIM3), inhibiting IFN-γ expression, inducing M2 macrophage polarization, and improving insulin sensitivity (J. Sun et al., 2018). (Figure 2)
Macrophages in inflammation, oxidative stress, and insulin resistance in non-alcoholic fatty liver d
Nutrient excess and low physical activity are also associated with increased lipid uptake and lipogenesis and decreased fatty acid oxidation resulting in increased intrahepatic triglyceride levels leading to hepatic steatosis and NAFLD. Increased gluconeogenesis is associated with increased intrahepatic glucose and insulin resistance. Among many proposed treatments, weight loss reduces NAFLD (K. S. Kim et al., 2019). (Figure 3)
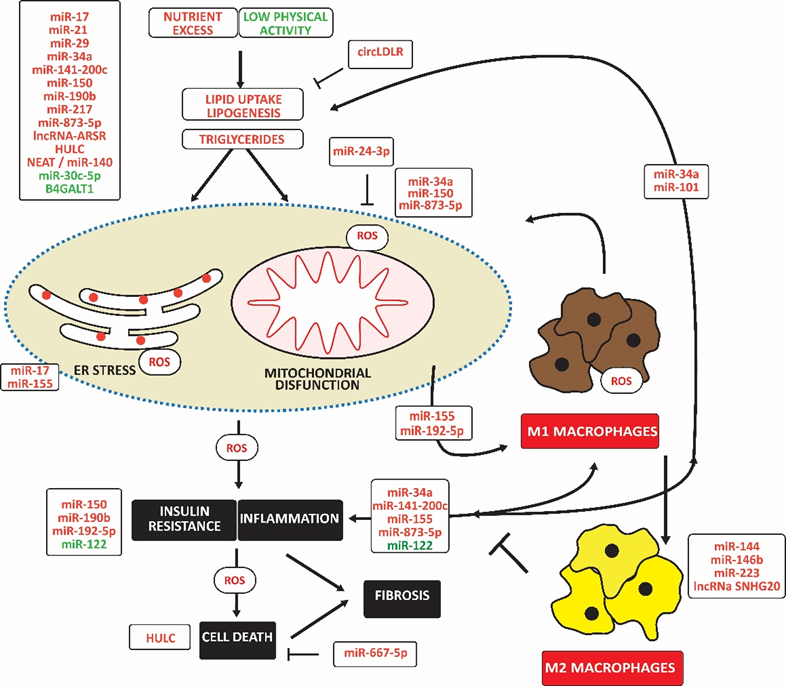
Noncoding RNAs may indirectly affect macrophage polarization by impairing lipid accumulation, causing mitochondrial and ER dysfunction with oxidative stress, and impairing insulin signaling. The upregulation of miR-miR-155 and miR-192-5p directly induced M1 macrophage polarization. In contrast, upregulated miR-144, miR-146b, miR-223, and lncNA SNHG20 induced M2 macrophage polarization. Upregulated noncoding RNAs are in red; downregulated noncoding RNAs are in green. Arrowheads indicate activation; hammerheads indicate inhibition.
Increased liver glucose and lipid levels are associated with mitochondrial dysfunction and mitochondrial ROS, which promote inflammation, insulin resistance, and cell death, aggravating the development of NAFLD (Bai & Li, 2019; Mansouri, Gattolliat, & Asselah, 2018). Hepatocellular injury attracts inflammatory cells, mainly monocytes, which differentiate into macrophages surrounding ballooned hepatocytes as crown-like structures (Stahl, Haschak, Popovic, & Brown, 2018). However, the Kupffer cell is the most highly represented macrophage type (Bilzer, Roggel, & Gerbes, 2006). The number of M1-polarized macrophages, possibly induced by IRF5, increases at the early stages of liver disease and promotes or exacerbates fibrosis, cirrhosis, and eventual liver failure (Alzaid et al., 2016; Liaskou et al., 2013). In addition, the oxidative stress-related 12-LOX catalyzes the conversion of membrane polyunsaturated fatty acids to oxidized proinflammatory lipid intermediates, linking inflammation to insulin resistance (Samala, Tersey, Chalasani, Anderson, & Mirmira, 2017).
Lipotoxicity is also associated with releasing danger-associated molecular patterns (DAMPs), which stimulate innate immunity through TLR4 and induce NLRP3 inflammation leading to cell death (Farrell, Haczeyni, & Chitturi, 2018). In addition, abnormal lipid accumulation often coincides with ER stress in hepatocytes, leading to an adaptive unfolded protein response, causing inflammation and cell death (Lebeaupin et al., 2018). Significantly, the p53 ortholog p63 and JAK link ER stress to inflammation, partially through NF-κB (Kondylis, Kumari, Vlantis, & Pasparakis, 2017). BCL2 family members, BAK and BAX, promote apoptosis in response to ER stress (Hetz et al., 2006). (Figure 3)
Role of noncoding RNA in macrophage polarization, inflammation, and insulin resistance in non-alcoho
Elevated miR-17 in type 2 diabetes with NAFLD increases free fatty acids-induced hepatocyte steatosis and decreases insulin sensitivity (Ye, Lou, Zhang, Dong, & Liu, 2018). MiR-17 also contributes to steatosis by decreasing the expression of cytochrome P450 family seven subfamilies A member 1, an ER membrane protein that catalyzes the conversion of cholesterol to bile acids (Gong, Lv, & Liu, 2018). Increased miR-21 and decreased PPAR-α increase fatty acid uptake, de novo lipogenesis, gluconeogenesis, and glucose output, ultimately leading to insulin resistance (Calo et al., 2016; Rodrigues et al., 2017). MiR-29 increases lipogenesis and circulating triglyceride levels in a SIRT1-dependent manner (Hung et al., 2019). MiR-34a, induced by inflammatory resistin, is associated with increased triglyceride content, decreased mitochondrial content, and impaired mitochondrial function, for example, by targeting SIRT1 (Natarajan et al., 2017). IL-6 and TNF-α induce miR-101, repressing ABCA1 and increasing lipid deposition (N. Zhang et al., 2015). High hepatic miR-141 and miR-200c levels are associated with high triglyceride levels associated with decreased microsomal triglyceride transfer protein and PPAR-α and increased sterol regulatory element binding transcription factor 1 and Fas cell surface death receptor, inflammation, and macrophage activation (Tran, Lee, Shin, & Wang, 2017). MiR-150 overexpression was associated with hepatic steatosis and insulin resistance in NAFLD mice by regulating the expression of genes related to gluconeogenesis, fatty acid uptake, and β-oxidation (Zhuge & Li, 2017). MiR-217 (C. L. Yang et al., 2019) decreased the expression of PPAR-α and SIRT1, thereby increasing lipid accumulation in hepatocytes. MiR-190b increases triglyceride and total cholesterol levels and induces glucose intolerance and insulin resistance by repressing IRS2/AKT signaling (M. Xu, Zheng, Jiang, & Qiu, 2018). MiR-199a-5p aggravated liver lipid accumulation in mouse hepatocytes, accompanied by down-regulation of hepatic macrophage stimulating one and modulation of hepatic lipogenesis and lipolysis, including sterol regulatory element binding protein (SREBP-1c) and AMPK signaling cascade (Y. Li et al., 2020). MiR-873-5p induced lipid accumulation, inflammation, and fibrosis by inhibiting fatty acid β-oxidation in the mitochondria (Fernandez-Tussy et al., 2019). Elevated expression of the lncRNA regulator of AKT signaling associated with HCC and RCC (lncRNA ARSR) is associated with enhanced hepatic lipogenesis via upregulating SREBP-1c (M. Zhang, Chi, Qu, & Wang, 2018). High hepatocellular carcinoma-upregulated lncRNA (HULC) levels are associated with liver lipid deposition, hepatic fibrosis, and apoptosis (X. Shen, Guo, Xu, & Wang, 2019). Furthermore, low levels of miR-30c-5p increase lipid accumulation (J. Fan et al., 2017). Low levels of lncRNA suppressor of hepatic gluconeogenesis and lipogenesis (lncSHGL in mice or B4GALT1-AS1 in humans) in fatty livers of obese diabetic mice were associated with elevated gluconeogenic and lipogenic gene [removed]J. Wang et al., 2018). In contrast, the circRNA low-density lipoprotein receptor (circLDLR) increases SIRT1 by targeting miR-667-5p, inhibiting the triglyceride and cholesterol content in hepatocytes and promoting autophagy (Yuan et al., 2022).
Furthermore, cholesterol-induced miR-192-5p inhibited the protein expression of mTOR, further inhibiting the phosphorylation levels of AKT and activating FOXO1, subsequently inducing an inflammatory response (X. L. Liu et al., 2020). Downregulation of miR-122-5p in Kupffer cells activated glycolysis, induced inflammation and fibrosis, and impaired insulin signaling (Inomata et al., 2022). In contrast, mesenchymal cell-derived exosomal miR-24-3p restrained ROS generation and inflammation by inhibiting Keap-1, potentiating NRF2 and antioxidant capacity (X. Du, Li, Han, & Ma, 2022). (Figure 3)
MiR-155 is associated with decreased binding of PPAR response element and PPAR-α and increased MCP1 production. Kupffer cells isolated from miR-155 deficient mice exhibited an M2 phenotype predominantly when exposed to M1 polarized signals (Bala et al., 2016). In addition, lipotoxic hepatocytes released miR-192-5p-enriched exosomes, which induced M1 macrophage activation and increased iNOS, IL-6, and TNF-α expression. In contrast, miR-144 targeted TLR2, reducing TLR2, TNF-α, and IFN-γ expression, preventing activation of NF-κB and inhibiting the progression of NASH in rats (D. Li et al., 2015). Finally, miR-146 b inhibited inflammation and steatosis by targeting TRAF6 and IRAK1 (Jiang et al., 2015). IL-6 secreted by myeloid cells induced macrophages to release miR-223-enriched exosomes. MiR-223 3p reduced the infiltration of monocytes, neutrophils, and early activated macrophages and downregulated the transcriptional expression of the proinflammatory cytokines IL-6 and IL-12, and the chemokines CCL2, CCL3, CXCL1, and CXCL2, mitigating fibrosis (Jimenez Calvente, Del Pilar, Tameda, Johnson, & Feldstein, 2020). LncRNA small nucleolar RNA host gene 20 (SNHG20) overexpression induced M2 polarization through activating STAT6 (B. Wang, Li, Hu, Zhou, & Din, 2019). (Figure 3)
Macrophages in inflammation, oxidative stress, and insulin resistance in atherosclerosis
Atherosclerosis develops in medium and large arteries at sites of high shear stress. Shear stress, high glucose, angiotensinogen (ANG II), and ox-LDL impair non-canonical Wnt and PI3K/AKT/NOS signaling, causing endothelium dysfunction (Franco et al., 2016; S. Kim & Woo, 2018). Endothelial dysfunction is associated with the secretion of adhesion molecules and the C-C motif chemokine receptor 2 (CCR2; or MCP-1 receptor). They facilitate the adhesion and infiltration of monocytes, which differentiate into macrophages (Resnick et al., 2003). ANG II causes endothelial injury and induces the migration of inflammatory cells, oxidative stress, angiogenesis, and vascular smooth muscle cell (VSMC) proliferation and differentiation by regulating the expression of integrins (Menendez-Castro et al., 2015). (Figure 4)
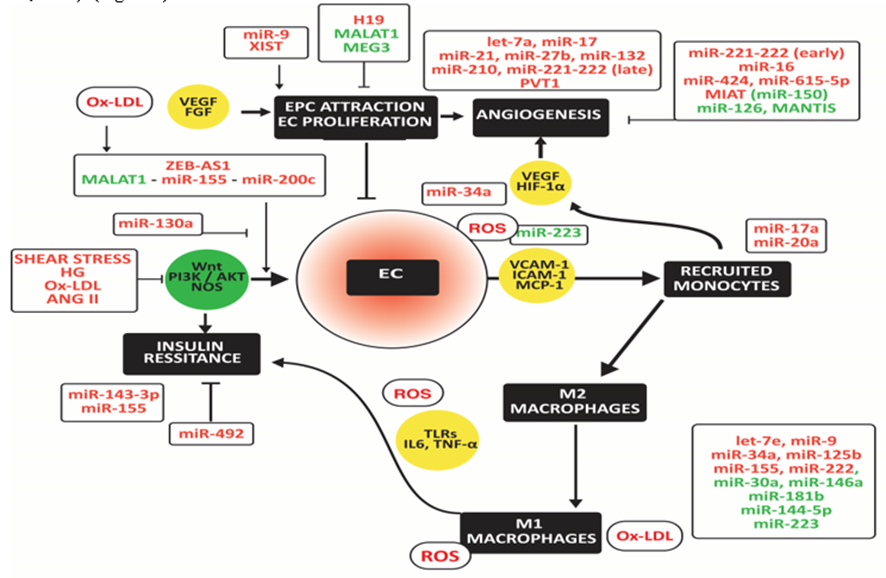
High miR-130 and miR-155 induce M1 macrophage polarization in metabolic tissues and tumors, while high miR-222 and lncRNA SNHG20 activate M2 macrophages. The inverse changes in expression of miR-27a, miR-29, miR-30a, miR-122, miR-140, miR-181a, miR193-5p, miR-2222, and miR-355 may explain the predominant shift to M1 macrophages in metabolic tissues and the predominant shift to m2 macrophages in tumors. Upregulated noncoding RNAs are in red; downregulated noncoding RNAs are in green.
Infiltrated monocytes differentiate into anti-inflammatory M2 macrophages. They secrete TGF-β and IL-10, which counteract vascular inflammation and immune cell activation. However, TGF-β also induces fibrosis in combination with IL-17 produced by inflammatory Th17 cells (Hansson, Libby, & Tabas, 2015). In addition, endothelial injury and subsequent adhesion of inflammatory cells result in ROS release, which polarizes M2 towards pro-inflammatory M1 macrophages (Cabrera-Fuentes et al., 2015). This activation involves increased expression of TLRs and downstream NF-κB, which elicit the release of pro-inflammatory cytokines, such as IL-6 and TNF-α (Cole, Georgiou, & Monaco, 2010). The interleukin-1 receptor-associated kinase-3 (IRAK3 or IRAK-M) inhibits macrophage activation and inflammatory cytokine secretion primarily by blocking TLR signaling (Hulsmans, Geeraert, et al., 2012). IRAK3 negatively regulates signaling by preventing the dissociation of IRAK1 and IRAK4 from MyD88 and forming IRAK - TNF receptor-associated factor-6 (TRAF6) complexes (van 't Veer et al., 2007). Low IRAK3 is associated with high superoxide dismutase (SOD)-2, a mitochondrial oxidative stress marker (Hulsmans, Geeraert, et al., 2012).
Activated macrophages secrete myeloperoxidase (MPO) and NADPH oxidase (NOX), oxidizing LDL. Ox-LDL damages the endothelium, closing a vicious circle (Holvoet, Lee, Steffes, Gross, & Jacobs, 2008). Macrophages express scavenger receptors (Van Berkel, Van Eck, Herijgers, Fluiter, & Nion, 2000; Van Eck, Pennings, Hoekstra, Out, & Van Berkel, 2005). Uptake of ox-LDL via these scavenger receptors is not harmful if levels of ATP-binding cassette transporters are adequate. Then macrophages transfer the surplus of cholesterol to HDL, facilitating further transport from the arterial wall to the liver, ultimately leading to bile release. If not, excess lipid accumulation leads to foam cell formation, ultimately leading to cell bursts, exposing extracellular debris that causes microthrombi, exacerbating inflammatory cells' infiltration. Scavenger receptors are, however, not only present at the surface of macrophages but also on the surface of endothelial cells (ECs). For example, the scavenger receptor SR-ECI cooperates with TLRs to trigger inflammatory innate immune responses (Murshid, Borges, Lang, & Calderwood, 2016). (Figure 4)
Role of noncoding RNA in macrophage polarization, inflammation, and insulin resistance in atheroscle
MiR-155-5p and miR-143-3p may cause insulin resistance in atherosclerotic vessels by targeting AKR and insulin growth factor receptor, respectively (Gonzalez-Lopez et al., 2022). In contrast, miR-492 improved blocked insulin resistance induced by p-STAT3, SOCS, and P-selectin in ECs (C. Ying et al., 2014).
Zinc finger E-box-binding homeobox two antisense RNA 1 (ZEB1-AS1) mediates ox-LDL-induced EC injury. Ox-LDL sequesters p53 from binding to the ZEB-AS1 promoter, thereby up-regulating ZEB-AS1 (X. Xu, Ma, Duan, Du, & Liu, 2019). The metastasis-associated lung adenocarcinoma transcript one lncRNA (MALAT1) is lower in human plaques than in normal arteries and lower in symptomatic than asymptomatic plaques. Low MALAT1 is associated with endothelial dysfunction and loss of protection against ox-LDL-induced cytokine release and apoptosis via upregulation of miR-155, increased by hypertension and inflammation (Cremer et al., 2012). Also, the decrease of MALAT1 and the up-regulation of miR-200c-3p is associated with oxygen-glucose deprivation (S. Wang et al., 2019). In contrast, miR-130a activates PI3K/AKT/eNOS pathway and thereby retains EC viability and NO release while it decreases inflammatory cytokine levels and cell apoptosis (C. L. Song et al., 2016). (Figure 4)
The repair of endothelium requires the attraction of endothelial progenitor cells (EPCs) and EC proliferation. MiR-9 promotes migration and invasion of EPCs by attenuating TRPM7 expression by activating the PI3K/AKT autophagy pathway (D. M. Zhou et al., 2020). X inactive specific transcript (XIST) stimulates hypoxia-induced angiogenesis (Hu, Bai, Liu, & Hu, 2019). In contrast, the H19 imprinted maternally expressed transcript lncRNA (H19) decreases EC proliferation and increases apoptosis by up-regulating mitogen-activated protein kinase and NF-kB (Pan, 2017; Z. Zhang et al., 2017). Ablation of MALAT1 and maternally expressed 3 lncRNA (MEG3), particularly in type 2 diabetes, is associated with reduced EC proliferation and migration and increased inflammation (Michalik et al., 2014; Qiu, Tian, Fu, Li, & Liu, 2016).
Several miRs correlate positively with angiogenesis. Let-7a is high in patients with hypertension, atherosclerosis, cardiac hypertrophy, and fibrosis (M. H. Bao et al., 2013); miR-21 up-regulated by ANG II (L. Y. Chen et al., 2019); and miR-27b by shear stress (Demolli et al., 2017). MiR-132 is high in patients with heart failure (Masson et al., 2018) and miR-210 in patients with aortic stenosis (Rosjo et al., 2014). Two members of the miR-17-92 cluster have opposite effects on angiogenesis. MiR-17 potentiates angiogenesis by facilitating the expression of HIF-1α and VEGF, which regulate each other. However, miR-92 blocks angiogenesis by silencing the integrin subunit alpha5 (Bonauer et al., 2009). Increased miR-221/222 in initial atherosclerotic plaques inhibits angiogenesis (Chistiakov, Sobenin, Orekhov, & Bobryshev, 2015). However, in advanced plaques, chronic inflammation down-regulates miR-221/222 in ECs and decreases the growth arrest-specific homeobox by decreased repression of ZEB2, resulting in increased angiogenesis (Dentelli et al., 2010). PVT1 oncogene (PVT1) binds and degrades miR 26b and promotes angiogenesis (Zheng et al., 2018).
Functionally, miR-16 and miR-424 inhibit angiogenesis via blocking VEGF (Bye et al., 2016; Chamorro-Jorganes et al., 2011; Devaux et al., 2013; Takahashi et al., 2016). The increase of miR-615-5p in response to vascular tissue injury inhibits VEGF/AKT/eNOS signaling (Icli et al., 2019). Myocardial infarction-associated transcript (MIAT) in diabetes impairs angiogenesis by silencing miR-150, generating a negative feedback loop with VEGF (Desjarlais, Dussault, Dhahri, Mathieu, & Rivard, 2017; B. Yan et al., 2015). The decrease of miR-126 and MANTIS inhibits angiogenic sprouting and alignment of ECs in response to shear stress and inflammation (Kuehbacher, Urbich, Zeiher, & Dimmeler, 2007; Leisegang et al., 2017). (Figure 4)
Endothelial injury is associated with increased infiltration of monocytes, which differentiate into macrophages. MiR-17a and miR-20a induce hypoxia-induced infiltration of monocytes and activation of macrophages (Chen et al., 2015; Jia et al., 2014; Poitz et al., 2013). Ox-LDL significantly up-regulates let-7e in ECs, promoting NF-κB activation and translocation to the nucleus by inhibiting its target gene IκBβ and subsequently increasing inflammation and the expression of adhesion molecules. In addition, miR-34a silences p53-small interfering RNA that attenuates high-glucose-induced endothelial inflammation and oxidative stress by repressing sirtuin (SIRT)-1 (J. Wu et al., 2019).
MiR-9 enhances M1 macrophage polarization by inhibiting PPAR-δ (Thulin et al., 2013). Palmitate, ox-LDL, TNF-α, or IL-6 significantly induced miR-34a, inducing M1 macrophage polarization and inhibiting ABCA1 and ABCG1expressions (Y. Xu et al., 2020). MiR-125b, upregulated in association with CAD, downregulates scavenger receptor class B member 1 in both human and mouse macrophages and VSMCs, thereby impairing macrophage cholesterol efflux (Hueso et al., 2022). MiR-155 promoted the ox-LDL-induced ERK1/2 phosphorylation and, subsequently, NLRP3 inflammasome activation in apoE KO mice (R. Yin et al., 2019). Ox-LDL induces toll-like receptor adaptor molecule one that up-regulates miR-155 in macrophages, associated with activation of the ERK1/2 and SOCS1/ STAT3/NF-κB signaling and elevation of IL6 and TNF-α levels (Y. Wu, Ye, Guo, Liang, & Yang, 2018). Exosomes derived from M1 macrophages aggravated neointimal hyperplasia by delivering miR-222 into VSMCs (Z. Wang et al., 2019).
MiR-30a-5p reduced atherosclerotic lesions in apoE KO mice, reduced levels of pro-inflammatory cytokines, increased levels of anti-inflammatory cytokines, and decreased the ratio of M1/M2 macrophages (F. Song et al., 2021). However, LPS and ox-LDL reduce the expression of miR-30a-5p. ApoE increased the expression of miR-146a, inhibiting macrophage proinflammatory responses and atherosclerosis in the settings of hyperlipidemia in mice (K. Li, Ching, Luk, & Raffai, 2015). However, lncRNA H19 inhibits miR-146a in mouse aorta with lipid-loaded macrophages and atherosclerosis (Huang, Zhao, Peng, & Ye, 2021). Furthermore, hypermethylation at the promoter of miR-181b, observed in blood monocytes of CAD patients, directly decreases miR-181b activity, increasing M1 macrophage polarization and inhibiting M2 macrophage polarization, accelerating atherosclerosis (Z. Wang et al., 2020). MiR-144-5p is downregulated in abdominal aortic aneurysms. MiR-144 suppressed ox-LDL-induced upregulation of M1 macrophage markers, including IL-1β, TNFα, prostaglandin-endoperoxide synthase 2, and nitric oxide synthase 2, in macrophages in abdominal aortic aneurysm, probably by targeting TLR2 (Shi et al., 2020). MiR-223 may block the activation of the NLRP3 inflammasome and M1 macrophage polarization (Y. Zhang et al., 2018), but its level is reduced in diseased hearts (Xue et al., 2020). (Figure 4)
Noncoding RNAs related to macrophage differentiation in cardiometabolic diseases, which are also to
Above, we found that high levels of let-7e, miR-9, miR-17, miR-27a, miR-29, miR-34a, miR-125b-5p, miR-130b, miR-140, miR-155, miR-192-5p, and miR-222, and low levels of miR-30a, miR-144, miR-146a/b, and miR-181b are associated with M1 macrophage polarization. Therefore, we reviewed changes in their expression related to cancer.
MiR-9, enriched in exosomes from head and neck squamous cell carcinoma cells, was transported into macrophages, inducing M1 macrophage polarization via downregulation of PPAR-δ (Tong et al., 2020). Exosomel hsa_circ_0017252 secreted by gastric cancer cells attenuated cancer progression by suppressing macrophage M2-like polarization by targeting miR-17 (J. Song et al., 2022). MiR-27a suppressed the JAK1/STAT-6 pathway and reduced the production of M2-type cytokines by targeting IRF4 and PPAR-γ (S. Ma et al., 2016). However, the miR-23a/27a/24-2 cluster was low in TAMs of breast cancer patients, and macrophages overexpressing the miR-23a/27a/24-2 cluster inhibited tumor growth. EZH2-induced reduction of miR-29 decreased M1 macrophage-associated TNF-α, NOS2, and IL-6 (H. Yin et al., 2020). TAMs secreted TGF-β1, which promoted the proliferation and invasion of cancer cells by downregulating miR-34a (D. Zhang et al., 2018). M2-targeted HA-PEI/PEG nanoparticles with miR-125b-5p induced M1 TAMs in pancreatic tissues derived from pancreatic adenocarcinoma (Parayath, Hong, Mackenzie, & Amiji, 2021). However, miR-125b-5p is often downregulated in breast cancer cells (Y. Wang, Fang, & Gu, 2022). Hsa-let-7c-5p, hsa-miR-130b-3p, and hsa-miR-142-3p correlated with activated dendritic cells, naïve CD4 T cells, and M1 macrophages in melanoma; but often they are downregulated (X. Wu et al., 2022). M2 macrophages or TAMs exposed to miR-130-enriched exosomes differentiated to M1, evidenced by the expression of IRF5, MCP1, CD80, and the secretion of IL-1β and TNF-α (Moradi-Chaleshtori, Bandehpour, Soudi, Mohammadi-Yeganeh, & Hashemi, 2021; Murria Estal et al., 2021). MiR-140 targeted the lncRNA LINC01140-CM, and silencing of this lncRNA significantly decreased the protein levels of the M2 marker CD206 while increasing the M1 marker CD16 in macrophages. Moreover, M2 markers IL-10 and Arg1 were low, while M1 markers iNOS and TNF-α were increased (S. Wu et al., 2020). However, miR-140 is often decreased in tumors (Lu et al., 2017). In addition, miR‐155 reprograms TAMs to proinflammatory M1 macrophages (Cai et al., 2012). However, MIR155HG is expressed higher in M2 macrophages and lower in M1 and sponges miR-155 (R. Liu, Sun, Hu, Peng, & Wu, 2022). Furthermore, ROS downregulated miR-155-5p expression in exosomes from tumor cells, which were taken up by macrophages, modulating their phenotype and the tumor microenvironment and favoring tumor growth (X. Li et al., 2022). The decrease of miR-222 in TAMs promoted tumor growth (Y. Li, L. Zhao, et al., 2015).
MiR-30a retained M2 TAM-induced EMT (Q. Zhang, Mao, & Sun, 2019). However, miR-30a is often downregulated, as in ovarian cancer (X. Wang et al., 2022). The downregulation of miR-144 in hepatocellular carcinoma was associated with decreased M1 macrophage polarization and antitumor activity (J. Zhao et al., 2021). NIFK antisense RNA 1 suppressed miR-146a and M2-like polarization of macrophages (Y. X. Zhou et al., 2018). Low miR-181b is associated with increased monocyte infiltration (Y. S. Liu et al., 2017). The transfer of miR-181b from cancer cells to macrophages favored M2 macrophage polarization (J. Ma et al., 2022).
Discussion
Our literature search revealed that miR-9, miR-17, miR-27a, miR-29, miR-30a, miR-34a, miR-122, miR-125b, miR-130b, miR-140, miR-144, miR-146a, miR-155, miR-181b, and miR-222 are related to macrophage polarization in association with metabolic diseases, atherosclerosis, and cancer. Of interest, the first group consisting of miR-17, miR-27a, miR-29a, miR-34a, miR-125b, miR-130b, miR-140, miR-155, and miR-222 tend to be overexpressed in cardiometabolic tissues, inducing M1 macrophage polarization and immune-mediated cell death. In contrast, they tend to be suppressed in tumors associated with M2 macrophage polarization and immunosuppression. In addition, the second group consisting of miR-30a, miR-122, miR-144, miR-146a/b, and miR-181b tend to be downregulated in cardiometabolic tissues and tumors. They are associated with M1 macrophage polarization and immune-mediated cell death in cardiometabolic tissues and tumors. Finally, miR-9 induces M1 polarization in cardiometabolic tissues and tumors.
It is essential to gain insight into differences in regulating this first group of miRs in cardiometabolic tissues compared to tumors. For example, hypoxia and hypoxia-inducible factor 1 (HIF-1α) (Blissenbach et al., 2018; J. Li et al., 2019) and high glucose up-regulate miR-17 in cardiometabolic tissues (M. Yan et al., 2019). IL-6 increases miR-17, but IFN-γ suppresses miR-17 in tumors, thereby reverting anti-inflammatory and anti-oxidative action in breast tumors (Hong, Xu, Grayson, & Shalev, 2016; Y. Li, Y. Shi, et al., 2015; Pena-Cano et al., 2019). MiR-27a levels increased with levels of hs-C-reactive protein and oxidized LDL, and the expression level of miR-27a was inversely related to ABCA1 and ABCG1 (Rafiei et al., 2021). However, hypoxia promotes lung cancer cell proliferation, migration, invasion, and EMT by inhibiting the miR-27a [removed]C. Liu, Deng, Wang, & Ren, 2022). Furthermore, MYC first upregulates miR-27a, but its promoter gets methylated early in prostate carcinogenesis, concomitantly with the loss of MYC regulatory activity. Along with prostate cancer progression, the miR-27a-5p promoter becomes hypomethylated, allowing MYC to resume its regulatory activity. However, the altered cellular context averts miR-27a-5p from accomplishing its tumor-suppressive function (Barros-Silva et al., 2018). In addition, hypoxia-reoxygenation and inflammatory IL-1β and IL-18 MCL1 induced miR-29, while the anti-apoptotic apoptosis regulator, BCL2 family member (MCL1), repressed miR-29 (Y. Wang et al., 2021). In contrast, high MYC in tumors represses miR-29 through a co-repressor complex with EZH2 that also represses miR-26a and miR-146a (Dey et al., 2020; Peta et al., 2018; Salvatori et al., 2011; Sander et al., 2008; X. Zhang et al., 2012). Finally, SMAD3 mediates the downregulation of miR-29 by TGF-β1 in tumors (Qin et al., 2011). IL-6 or TNF-α-activated p65 could bind to the miR-34a promotor and enhance its activity, increasing its transcription. NF-κB induces miR-34a with FN-γ and ROS, downregulating SIRT1 (Kauppinen, Suuronen, Ojala, Kaarniranta, & Salminen, 2013; Xie et al., 2019). Consequently, the inhibition of SIRT1 stimulates NF-κB-induced inflammation. In contrast, hypoxia down-regulates miR-34a, thereby promoting EMT by targeting the NOTCH signaling axis (R. Du et al., 2012). Furthermore, MYC inhibits miR-34a expression directly or by inducing lncRNA-SNHG7, which silences miR-34a (P. C. Chen et al., 2019; L. Zhang, Fu, & Guo, 2019). Finally, TGF-β secreted by tumor-associated macrophages promotes proliferation and invasion of colorectal cancer via the silencing of miR-34a, thereby upregulating VEGF (D. Zhang et al., 2018). Glucose upregulates miR-125b-5p, mediating some of the deleterious effects of hyperglycemia in β cells (Cheung et al., 2022). In addition, CRP, TNF-α, IL-6, IL-17, and IL-23 were positively related to miR-125b (J. Zhao et al., 2021). Significantly IL-6/STAT3 signaling induced miR-125 (Dai et al., 2018). In contrast, AKT1 and AKT3 activation in drug-resistant colon cancer cells downregulated miR-125b-5p, leading to GLUT5 [removed]Park, Jeong, & Kim, 2020). In addition, ROS inhibit miR-125b expression by increasing its promoter methylation (He et al., 2012). Furthermore, MYC downregulates the miR-100/let-7a-2/miR-125b-1 cluster (Cairo et al., 2010). Increased levels of miR-130, miR-140-5p, miR-142-3p, miR-143, and miR-222, and decreased concentrations of miR-15a, miR-146a, miR-423-5p, and miR-520c-3p are strongly linked to measures of BMI, waist circumference, leptin, insulin, HOMA-IR, TG, and HDL-cholesterol (Al-Rawaf, 2019). TGF-β1 decreased the expression of miR-130b in colorectal cancer cells (Yi et al., 2016). In addition, IGF-1 was inversely related to miR-130b, miR-9-5p, miR-9-3p, and miR-181d (Ho et al., 2017). IL-1β induces miR-140-3p (Luobu et al., 2022), and TGF-β/SMAD3 inhibits the expression of miR-140 (Tardif et al., 2013). Furthermore, the oncogenic flap endonuclease 1 targeted miR-140-5p, downregulated in hepatocellular carcinoma, allowing TGF-β1-induced EMT (C. Li et al., 2019). MiR-155-5p and its host gene MIR155HG are enhanced by antigen receptor stimulation of B- and T-cells or by TLR agonist stimulation of macrophages and dendritic cells (Elton, Selemon, Elton, & Parinandi, 2013). Moreover, LPS induces miR-155, exerting a regulatory effect on NLRP3 inflammasome activation in ox-LDL-induced macrophages (Cunha, Gomes, Vaz, & Brites, 2016; R. Yin et al., 2019). However, ROS in tumors inhibited the expression of miR-155, thereby inhibiting macrophage infiltration and activation of cytotoxic CD8+ T cells (X. Li et al., 2022). The lactic acid in tumors with elevated IL33 and mast cell infiltration also suppresses miR-155-5p in a HIF-1α-dependent manner (Abebayehu et al., 2016). Prolonged exposure to LPS and TNF-α upregulated the expression of miR-222 (Seeley et al., 2018; Xia et al., 2021). In addition, the high-mobility group box one protein, a late inflammatory cytokine that signals danger to the immune system through the receptor for AGEs and TLRs, induces the expression of mir-222 in cancer cells (Mardente et al., 2012). In contrast, IFNs inhibit the expression of miR-222 and miR-27a (Cunha et al., 2016). In addition, the snail family transcriptional repressor two induced EMT by inhibiting E-cadherin expression by repressing miR-222 (L. Fan et al., 2020).
Next is the group of downregulated miRs in cardiometabolic and tumor tissues. MiR-30a and miR-26a levels inversely correlate to IL1-β (Caserta et al., 2016). TGF-β-induced lincRNA-p21 promotes liver inflammation and fibrosis by inhibiting miR-30a (Tu et al., 2017). In addition, hypoxia downregulates miR-30a (C. G. Xu, Yang, Fan, & Wang, 2016). MiR-122 expression is regulated by liver-enriched transcription factors such as hepatocyte nuclear factor (HNF)1α, HNF3β, HNF4α, HNF6, and CCAAT/enhancer-binding protein (C/EBP) α. A positive feedback loop exists between C/EBPα and miR-122 and between HNF6 and miR-122, whereas a negative feedback loop exists between MYC and miR-122 in hepatocellular carcinoma cells (Nakao, Miyaaki, & Ichikawa, 2014). Furthermore, hypoxia reduces miR-122-5p in hepatocellular cancer cells (X. Yang et al., 2019). TNFα and ceramide reduced miR-144/451 (Orsini et al., 2019).
Leukotriene B4, an inflammation mediator derived from arachidonic acid by 5-lipoxygenase and 5-lipoxygenase–activating protein, activates macrophages by inducing miR-155, miR-146b, and miR-125b (Z. Wang et al., 2014; Yokomizo, Nakamura, & Shimizu, 2018). In addition, IL-6 correlated positively with miR-146a/b in breast cancer tissues. However, overexpression of oncogenic RAS, MYC, NF-κB, JUN, TRAF6, and IRAK4 was inversely related to miR-146 (Ranjbar, Hesari, Ghasemi, & Sahebkar, 2018). Ox-LDL induces MIAT that silences miR-181b (X. Zhong et al., 2018) and increases TUG1 (X. Wu, Zheng, Cheng, Zhang, & Ma, 2020). TGF-β1 significantly upregulated the expression of miR-181a-5p, miR-181b-5p, and miR-181d-5p in renal cancer cells (Hanusek et al., 2022). In addition, GM-CSF and IL-6-activated STAT3 and CEBPβ synergistically induced the expression of miR-21a, miR-21b, and miR-181b (Z. Zhang, Huang, Wang, Huang, & Yang, 2020). In contrast, hypoxia reduced miR-181b levels (Lv et al., 2020).
In conclusion, our literature search revealed noncoding RNAs which regulate macrophage differentiation in cardiometabolic tissues and tumors. Especially the inverse regulation of miR-17, miR-27a, miR-29a, miR-34a, miR-125b, miR-130b, miR-140, miR-155, and miR-222 in cardiometabolic tissues compared to tumors may explain the predominant M1 polarization of macrophages in cardiometabolic tissues compared to the M2 macrophage polarization in tumors. However, M1 and M2 phenotypes are extremes of a continuum of functional states. Although insight into the molecular targets regulated by these miRs is rising, essential information about their regulation is largely lacking. Moreover, information from studies focusing on only one or a few of these miRs led to this theoretical model, but cluster analysis is yet to be performed. In addition, insight into the stage-dependent changes in miR cluster expression is missing. Therefore, further research on the kinetics of changes in expression related to the metabolic reprogramming of macrophages is warranted.
Acknowledgments
No funding was available
Conflicts of interest
There are no conflicts of interest
References
- .Abebayehu, D., Spence, A. J., Qayum, A. A., Taruselli, M. T., McLeod, J. J., Caslin, H. L., . . . Ryan, J. J. (2016). Lactic Acid Suppresses IL-33-Mediated Mast Cell Inflammatory Responses via Hypoxia-Inducible Factor-1alpha-Dependent miR-155 Suppression. J Immunol, 197(7), 2909-2917.
View at Publisher | View at Google Scholar - Abel, E. D., Peroni, O., Kim, J. K., Kim, Y. B., Boss, O., Hadro, E., . . . Kahn, B. B. (2001). Adipose-selective targeting of the GLUT4 gene impairs insulin action in muscle and liver. Nature, 409(6821), 729-733.
View at Publisher | View at Google Scholar - Al-Rawaf, H. A. (2019). Circulating microRNAs and adipokines as markers of metabolic syndrome in adolescents with obesity. Clin Nutr, 38(5), 2231-2238. doi:10.1016/j.clnu.2018.09.024
View at Publisher | View at Google Scholar - Alzaid, F., Lagadec, F., Albuquerque, M., Ballaire, R., Orliaguet, L., Hainault, I., . . . Venteclef, N. (2016). IRF5 governs liver macrophage activation that promotes hepatic fibrosis in mice and humans. JCI Insight, 1(20), e88689.
View at Publisher | View at Google Scholar - Araki, E., Oyadomari, S., & Mori, M. (2003). Impact of endoplasmic reticulum stress pathway on pancreatic beta-cells and diabetes mellitus. Exp Biol Med (Maywood), 228(10), 1213-1217.
View at Publisher | View at Google Scholar - Arranz, A., Doxaki, C., Vergadi, E., Martinez de la Torre, Y., Vaporidi, K., Lagoudaki, E. D., . . . Tsatsanis, C. (2012). Akt1 and Akt2 protein kinases differentially contribute to macrophage polarization. Proc Natl Acad Sci U S A, 109(24), 9517-9522.
View at Publisher | View at Google Scholar - Bai, L., & Li, H. (2019). Innate immune regulatory networks in hepatic lipid metabolism. J Mol Med (Berl), 97(5), 593-604.
View at Publisher | View at Google Scholar - Bala, S., Csak, T., Saha, B., Zatsiorsky, J., Kodys, K., Catalano, D., . . . Szabo, G. (2016). The pro-inflammatory effects of miR-155 promote liver fibrosis and alcohol-induced steatohepatitis. J Hepatol, 64(6), 1378-1387.
View at Publisher | View at Google Scholar - Banks, A. S., Davis, S. M., Bates, S. H., & Myers, M. G., Jr. (2000). Activation of downstream signals by the long form of the leptin receptor. J Biol Chem, 275(19), 14563-14572.
View at Publisher | View at Google Scholar - Bao, F., Slusher, A. L., Whitehurst, M., & Huang, C. J. (2018). Circulating microRNAs are upregulated following acute aerobic exercise in obese individuals. Physiol Behav, 197, 15-21.
View at Publisher | View at Google Scholar - Bao, M. H., Feng, X., Zhang, Y. W., Lou, X. Y., Cheng, Y., & Zhou, H. H. (2013). Let-7 in cardiovascular diseases, heart development and cardiovascular differentiation from stem cells. Int J Mol Sci, 14(11), 23086-23102.
View at Publisher | View at Google Scholar - Barros-Silva, D., Costa-Pinheiro, P., Duarte, H., Sousa, E. J., Evangelista, A. F., Graca, I., . . . Jeronimo, C. (2018). MicroRNA-27a-5p regulation by promoter methylation and MYC signaling in prostate carcinogenesis. Cell Death Dis, 9(2), 167.
View at Publisher | View at Google Scholar - Belarbi, Y., Mejhert, N., Lorente-Cebrian, S., Dahlman, I., Arner, P., Ryden, M., & Kulyte, A. (2015). MicroRNA-193b Controls Adiponectin Production in Human White Adipose Tissue. J Clin Endocrinol Metab, 100(8), E1084-1088.
View at Publisher | View at Google Scholar - Bilzer, M., Roggel, F., & Gerbes, A. L. (2006). Role of Kupffer cells in host defense and liver disease. Liver Int, 26(10), 1175-1186.
View at Publisher | View at Google Scholar - Bjorbaek, C., Elmquist, J. K., Frantz, J. D., Shoelson, S. E., & Flier, J. S. (1998). Identification of SOCS-3 as a potential mediator of central leptin resistance. Mol Cell, 1(4), 619-625.
View at Publisher | View at Google Scholar - Blissenbach, B., Nakas, C. T., Kronke, M., Geiser, T., Merz, T. M., & Pichler Hefti, J. (2018). Hypoxia-induced changes in plasma micro-RNAs correlate with pulmonary artery pressure at high altitude. Am J Physiol Lung Cell Mol Physiol, 314(1), L157-L164.
View at Publisher | View at Google Scholar - Bonauer, A., Carmona, G., Iwasaki, M., Mione, M., Koyanagi, M., Fischer, A., . . . Dimmeler, S. (2009). MicroRNA-92a controls angiogenesis and functional recovery of ischemic tissues in mice. Science, 324(5935), 1710-1713.
View at Publisher | View at Google Scholar - Brestoff, J. R., Wilen, C. B., Moley, J. R., Li, Y., Zou, W., Malvin, N. P., . . . Teitelbaum, S. L. (2021). Intercellular Mitochondria Transfer to Macrophages Regulates White Adipose Tissue Homeostasis and Is Impaired in Obesity. Cell Metab, 33(2), 270-282 e278.
View at Publisher | View at Google Scholar - Bye, A., Rosjo, H., Nauman, J., Silva, G. J., Follestad, T., Omland, T., & Wisloff, U. (2016). Circulating microRNAs predict future fatal myocardial infarction in healthy individuals - The HUNT study. J Mol Cell Cardiol, 97, 162-168.
View at Publisher | View at Google Scholar - Cabrera-Fuentes, H. A., Lopez, M. L., McCurdy, S., Fischer, S., Meiler, S., Baumer, Y., . . . Boisvert, W. A. (2015). Regulation of monocyte/macrophage polarisation by extracellular RNA. Thromb Haemost, 113(3), 473-481.
View at Publisher | View at Google Scholar - Cai, X., Yin, Y., Li, N., Zhu, D., Zhang, J., Zhang, C. Y., & Zen, K. (2012). Re-polarization of tumor-associated macrophages to pro-inflammatory M1 macrophages by microRNA-155. J Mol Cell Biol, 4(5), 341-343.
View at Publisher | View at Google Scholar - Cairo, S., Wang, Y., de Reynies, A., Duroure, K., Dahan, J., Redon, M. J., . . . Buendia, M. A. (2010). Stem cell-like micro-RNA signature driven by Myc in aggressive liver cancer. Proc Natl Acad Sci U S A, 107(47), 20471-20476.
View at Publisher | View at Google Scholar - Calo, N., Ramadori, P., Sobolewski, C., Romero, Y., Maeder, C., Fournier, M., . . . Foti, M. (2016). Stress-activated miR-21/miR-21* in hepatocytes promotes lipid and glucose metabolic disorders associated with high-fat diet consumption. Gut, 65(11), 1871-1881.
View at Publisher | View at Google Scholar - Caserta, S., Kern, F., Cohen, J., Drage, S., Newbury, S. F., & Llewelyn, M. J. (2016). Circulating Plasma microRNAs can differentiate Human Sepsis and Systemic Inflammatory Response Syndrome (SIRS). Sci Rep, 6, 28006.
View at Publisher | View at Google Scholar - Caslin, H. L., Bhanot, M., Bolus, W. R., & Hasty, A. H. (2020). Adipose tissue macrophages: Unique polarization and bioenergetics in obesity. Immunol Rev, 295(1), 101-113.
View at Publisher | View at Google Scholar - Chamorro-Jorganes, A., Araldi, E., Penalva, L. O., Sandhu, D., Fernandez-Hernando, C., & Suarez, Y. (2011). MicroRNA-16 and microRNA-424 regulate cell-autonomous angiogenic functions in endothelial cells via targeting vascular endothelial growth factor receptor-2 and fibroblast growth factor receptor-1. Arterioscler Thromb Vasc Biol, 31(11), 2595-2606.
View at Publisher | View at Google Scholar - Chang, L., Chiang, S. H., & Saltiel, A. R. (2004). Insulin signaling and the regulation of glucose transport. Mol Med, 10(7-12), 65-71.
View at Publisher | View at Google Scholar - Chen, J., Xu, L., Hu, Q., Yang, S., Zhang, B., & Jiang, H. (2015). MiR-17-5p as circulating biomarkers for the severity of coronary atherosclerosis in coronary artery disease. Int J Cardiol, 197, 123-124.
View at Publisher | View at Google Scholar - Chen, L. Y., Wang, X., Qu, X. L., Pan, L. N., Wang, Z. Y., Lu, Y. H., & Hu, H. Y. (2019). Activation of the STAT3/microRNA-21 pathway participates in angiotensin II-induced angiogenesis. J Cell Physiol.
View at Publisher | View at Google Scholar - Chen, P., Miao, Y., Yan, P., Wang, X. J., Jiang, C., & Lei, Y. (2019). MiR-455-5p ameliorates HG-induced apoptosis, oxidative stress and inflammatory via targeting SOCS3 in retinal pigment epithelial cells. J Cell Physiol, 234(12), 21915-21924.
View at Publisher | View at Google Scholar - Chen, P. C., Yu, C. C., Huang, W. Y., Huang, W. H., Chuang, Y. M., Lin, R. I., . . . Chan, M. W. Y. (2019). c-Myc Acts as a Competing Endogenous RNA to Sponge miR-34a, in the Upregulation of CD44, in Urothelial Carcinoma. Cancers (Basel), 11(10).
View at Publisher | View at Google Scholar - Cheung, R., Pizza, G., Chabosseau, P., Rolando, D., Tomas, A., Burgoyne, T., . . . Martinez-Sanchez, A. (2022). Glucose-Dependent miR-125b Is a Negative Regulator of beta-Cell Function. Diabetes, 71(7), 1525-1545.
View at Publisher | View at Google Scholar - Chistiakov, D. A., Sobenin, I. A., Orekhov, A. N., & Bobryshev, Y. V. (2015). Human miR-221/222 in Physiological and Atherosclerotic Vascular Remodeling. Biomed Res Int, 2015, 354517.
View at Publisher | View at Google Scholar - Cho, H., Seo, Y., Loke, K. M., Kim, S. W., Oh, S. M., Kim, J. H., . . . Williams, D. R. (2018). Cancer-Stimulated CAFs Enhance Monocyte Differentiation and Protumoral TAM Activation via IL6 and GM-CSF Secretion. Clin Cancer Res, 24(21), 5407-5421.
View at Publisher | View at Google Scholar - Cole, J. E., Georgiou, E., & Monaco, C. (2010). The expression and functions of toll-like receptors in atherosclerosis. Mediators Inflamm, 2010, 393946.
View at Publisher | View at Google Scholar - Costantino, S., Libby, P., Kishore, R., Tardif, J. C., El-Osta, A., & Paneni, F. (2018). Epigenetics and precision medicine in cardiovascular patients: from basic concepts to the clinical arena. Eur Heart J, 39(47), 4150-4158.
View at Publisher | View at Google Scholar - Cremer, T. J., Fatehchand, K., Shah, P., Gillette, D., Patel, H., Marsh, R. L., . . . Tridandapani, S. (2012). MiR-155 induction by microbes/microbial ligands requires NF-kappaB-dependent de novo protein synthesis. Front Cell Infect Microbiol, 2, 73.
View at Publisher | View at Google Scholar - Cucak, H., Mayer, C., Tonnesen, M., Thomsen, L. H., Grunnet, L. G., & Rosendahl, A. (2014). Macrophage contact dependent and independent TLR4 mechanisms induce beta-cell dysfunction and apoptosis in a mouse model of type 2 diabetes. PLoS One, 9(3), e90685.
View at Publisher | View at Google Scholar - Cunha, C., Gomes, C., Vaz, A. R., & Brites, D. (2016). Exploring New Inflammatory Biomarkers and Pathways during LPS-Induced M1 Polarization. Mediators Inflamm, 2016, 6986175.
View at Publisher | View at Google Scholar - Dai, C. Y., Tsai, Y. S., Chou, W. W., Liu, T., Huang, C. F., Wang, S. C., . . . Yu, M. L. (2018). The IL-6/STAT3 pathway upregulates microRNA-125b expression in hepatitis C virus infection. Oncotarget, 9(13), 11291-11302.
View at Publisher | View at Google Scholar - Dang, S. Y., Leng, Y., Wang, Z. X., Xiao, X., Zhang, X., Wen, T., . . . Ma, Y. (2019). Exosomal transfer of obesity adipose tissue for decreased miR-141-3p mediate insulin resistance of hepatocytes. Int J Biol Sci, 15(2), 351-368.
View at Publisher | View at Google Scholar - Demolli, S., Doddaballapur, A., Devraj, K., Stark, K., Manavski, Y., Eckart, A., . . . Dimmeler, S. (2017). Shear stress-regulated miR-27b controls pericyte recruitment by repressing SEMA6A and SEMA6D. Cardiovasc Res, 113(6), 681-691.
View at Publisher | View at Google Scholar - Dentelli, P., Rosso, A., Orso, F., Olgasi, C., Taverna, D., & Brizzi, M. F. (2010). microRNA-222 controls neovascularization by regulating signal transducer and activator of transcription 5A expression. Arterioscler Thromb Vasc Biol, 30(8), 1562-1568.
View at Publisher | View at Google Scholar - Desjarlais, M., Dussault, S., Dhahri, W., Mathieu, R., & Rivard, A. (2017). MicroRNA-150 Modulates Ischemia-Induced Neovascularization in Atherosclerotic Conditions. Arterioscler Thromb Vasc Biol, 37(5), 900-908.
View at Publisher | View at Google Scholar - Devaux, Y., Vausort, M., McCann, G. P., Kelly, D., Collignon, O., Ng, L. L., . . . Squire, I. B. (2013). A panel of 4 microRNAs facilitates the prediction of left ventricular contractility after acute myocardial infarction. PLoS One, 8(8), e70644.
View at Publisher | View at Google Scholar - Dey, S., Kwon, J. J., Liu, S., Hodge, G. A., Taleb, S., Zimmers, T. A., . . . Kota, J. (2020). miR-29a Is Repressed by MYC in Pancreatic Cancer and Its Restoration Drives Tumor-Suppressive Effects via Downregulation of LOXL2. Mol Cancer Res, 18(2), 311-323.
View at Publisher | View at Google Scholar - Di Francesco, A., Choi, Y., Bernier, M., Zhang, Y., Diaz-Ruiz, A., Aon, M. A., . . . de Cabo, R. (2020). NQO1 protects obese mice through improvements in glucose and lipid metabolism. NPJ Aging Mech Dis, 6(1), 13.
View at Publisher | View at Google Scholar - Dowling, J. K., Afzal, R., Gearing, L. J., Cervantes-Silva, M. P., Annett, S., Davis, G. M., . . . McCoy, C. E. (2021). Mitochondrial arginase-2 is essential for IL-10 metabolic reprogramming of inflammatory macrophages. Nat Commun, 12(1), 1460.
View at Publisher | View at Google Scholar - Du, R., Sun, W., Xia, L., Zhao, A., Yu, Y., Zhao, L., . . . Sun, S. (2012). Hypoxia-induced down-regulation of microRNA-34a promotes EMT by targeting the Notch signaling pathway in tubular epithelial cells. PLoS One, 7(2), e30771.
View at Publisher | View at Google Scholar - Du, X., Li, H., Han, X., & Ma, W. (2022). Mesenchymal stem cells-derived exosomal miR-24-3p ameliorates non-alcohol fatty liver disease by targeting Keap-1. Biochem Biophys Res Commun, 637, 331-340.
View at Publisher | View at Google Scholar - Dubinsky, A. N., Dastidar, S. G., Hsu, C. L., Zahra, R., Djakovic, S. N., Duarte, S., . . . La Spada, A. R. (2014). Let-7 coordinately suppresses components of the amino acid sensing pathway to repress mTORC1 and induce autophagy. Cell Metab, 20(4), 626-638.
View at Publisher | View at Google Scholar - Ebrahimpour, S., Shahidi, S. B., Abbasi, M., Tavakoli, Z., & Esmaeili, A. (2020). Quercetin-conjugated superparamagnetic iron oxide nanoparticles (QCSPIONs) increases Nrf2 expression via miR-27a mediation to prevent memory dysfunction in diabetic rats. Sci Rep, 10(1), 15957.
View at Publisher | View at Google Scholar - Elton, T. S., Selemon, H., Elton, S. M., & Parinandi, N. L. (2013). Regulation of the MIR155 host gene in physiological and pathological processes. Gene, 532(1), 1-12.
View at Publisher | View at Google Scholar - Engin, A. (2017). The Pathogenesis of Obesity-Associated Adipose Tissue Inflammation. Adv Exp Med Biol, 960, 221-245. doi:10.1007/978-3-319-48382-5_9
View at Publisher | View at Google Scholar - Erin, N., Grahovac, J., Brozovic, A., & Efferth, T. (2020). Tumor microenvironment and epithelial mesenchymal transition as targets to overcome tumor multidrug resistance. Drug Resist Updat, 53, 100715.
View at Publisher | View at Google Scholar - Fan, J., Li, H., Nie, X., Yin, Z., Zhao, Y., Chen, C., & Wen Wang, D. (2017). MiR-30c-5p ameliorates hepatic steatosis in leptin receptor-deficient (db/db) mice via down-regulating FASN. Oncotarget, 8(8), 13450-13463.
View at Publisher | View at Google Scholar - Fan, L., Lei, H., Zhang, S., Peng, Y., Fu, C., Shu, G., & Yin, G. (2020). Non-canonical signaling pathway of SNAI2 induces EMT in ovarian cancer cells by suppressing miR-222-3p transcription and upregulating PDCD10. Theranostics, 10(13), 5895-5913.
View at Publisher | View at Google Scholar - Farrell, G. C., Haczeyni, F., & Chitturi, S. (2018). Pathogenesis of NASH: How Metabolic Complications of Overnutrition Favour Lipotoxicity and Pro-Inflammatory Fatty Liver Disease. Adv Exp Med Biol, 1061, 19-44.
View at Publisher | View at Google Scholar - Faulds, M. H., & Dahlman-Wright, K. (2012). Metabolic diseases and cancer risk. Curr Opin Oncol, 24(1), 58-61.
View at Publisher | View at Google Scholar - Fernandez-Tussy, P., Fernandez-Ramos, D., Lopitz-Otsoa, F., Simon, J., Barbier-Torres, L., Gomez-Santos, B., . . . Martinez-Chantar, M. L. (2019). miR-873-5p targets mitochondrial GNMT-Complex II interface contributing to non-alcoholic fatty liver disease. Mol Metab, 29, 40-54.
View at Publisher | View at Google Scholar - Franco, C. A., Jones, M. L., Bernabeu, M. O., Vion, A. C., Barbacena, P., Fan, J., . . . Gerhardt, H. (2016). Non-canonical Wnt signalling modulates the endothelial shear stress flow sensor in vascular remodelling. Elife, 5, e07727.
View at Publisher | View at Google Scholar - Fuentes, L., Roszer, T., & Ricote, M. (2010). Inflammatory mediators and insulin resistance in obesity: role of nuclear receptor signaling in macrophages. Mediators Inflamm, 2010, 219583.
View at Publisher | View at Google Scholar - Fuster, J. J., Ouchi, N., Gokce, N., & Walsh, K. (2016). Obesity-Induced Changes in Adipose Tissue Microenvironment and Their Impact on Cardiovascular Disease. Circ Res, 118(11), 1786-1807. doi:10.1161/CIRCRESAHA.115.306885
View at Publisher | View at Google Scholar - Genin, M., Clement, F., Fattaccioli, A., Raes, M., & Michiels, C. (2015). M1 and M2 macrophages derived from THP-1 cells differentially modulate the response of cancer cells to etoposide. BMC Cancer, 15, 577. doi:10.1186/s12885-015-1546-9
View at Publisher | View at Google Scholar - Ginckels, P., & Holvoet, P. (2022). Oxidative Stress and Inflammation in Cardiovascular Diseases and Cancer: Role of Non-coding RNAs. Yale J Biol Med, 95(1), 129-152. Retrieved from https://www.ncbi.nlm.nih.gov/pubmed/35370493
View at Publisher | View at Google Scholar - Gong, R., Lv, X., & Liu, F. (2018). MiRNA-17 encoded by the miR-17-92 cluster increases the potential for steatosis in hepatoma cells by targeting CYP7A1. Cell Mol Biol Lett, 23, 16. doi:10.1186/s11658-018-0083-3
View at Publisher | View at Google Scholar - Gonzalez-Lopez, P., Ares-Carral, C., Lopez-Pastor, A. R., Infante-Menendez, J., Gonzalez Illaness, T., Vega de Ceniga, M., . . . Gomez-Hernandez, A. (2022). Implication of miR-155-5p and miR-143-3p in the Vascular Insulin Resistance and Instability of Human and Experimental Atherosclerotic Plaque. Int J Mol Sci, 23(18). doi:10.3390/ijms231810253
View at Publisher | View at Google Scholar - Gordon, S. (2003). Alternative activation of macrophages. Nat Rev Immunol, 3(1), 23-35. doi:10.1038/nri978
View at Publisher | View at Google Scholar - Gordon, S., & Martinez, F. O. (2010). Alternative activation of macrophages: mechanism and functions. Immunity, 32(5), 593-604. doi:10.1016/j.immuni.2010.05.007
View at Publisher | View at Google Scholar - Guo, X., Xue, H., Shao, Q., Wang, J., Guo, X., Chen, X., . . . Li, G. (2016). Hypoxia promotes glioma-associated macrophage infiltration via periostin and subsequent M2 polarization by upregulating TGF-beta and M-CSFR. Oncotarget, 7(49), 80521-80542. doi:10.18632/oncotarget.11825
View at Publisher | View at Google Scholar - Han, X., Ma, W., Zhu, Y., Sun, X., & Liu, N. (2020). Advanced glycation end products enhance macrophage polarization to the M1 phenotype via the HIF-1alpha/PDK4 pathway. Mol Cell Endocrinol, 514, 110878. doi:10.1016/j.mce.2020.110878
View at Publisher | View at Google Scholar - Han, Y., Huang, Y., Gao, P., Yang, Q., Jia, L., Zheng, Y., & Li, W. (2022). Leptin Aggravates Periodontitis by Promoting M1 Polarization via NLRP3. J Dent Res, 101(6), 675-685. doi:10.1177/00220345211059418
View at Publisher | View at Google Scholar - Han, Y. B., Tian, M., Wang, X. X., Fan, D. H., Li, W. Z., Wu, F., & Liu, L. (2020). Berberine ameliorates obesity-induced chronic inflammation through suppression of ER stress and promotion of macrophage M2 polarization at least partly via downregulating lncRNA Gomafu. Int Immunopharmacol, 86, 106741. doi:10.1016/j.intimp.2020.106741
View at Publisher | View at Google Scholar - Hansson, G. K., Libby, P., & Tabas, I. (2015). Inflammation and plaque vulnerability. J Intern Med, 278(5), 483-493. doi:10.1111/joim.12406
View at Publisher | View at Google Scholar - Hanusek, K., Rybicka, B., Poplawski, P., Adamiok-Ostrowska, A., Gluchowska, K., Piekielko-Witkowska, A., & Boguslawska, J. (2022). TGF‑beta1 affects the renal cancer miRNome and regulates tumor cells proliferation. Int J Mol Med, 49(4). doi:10.3892/ijmm.2022.5108
View at Publisher | View at Google Scholar - He, J., Xu, Q., Jing, Y., Agani, F., Qian, X., Carpenter, R., . . . Jiang, B. H. (2012). Reactive oxygen species regulate ERBB2 and ERBB3 expression via miR-199a/125b and DNA methylation. EMBO Rep, 13(12), 1116-1122. doi:10.1038/embor.2012.162
View at Publisher | View at Google Scholar - Heneghan, H. M., Miller, N., McAnena, O. J., O'Brien, T., & Kerin, M. J. (2011). Differential miRNA expression in omental adipose tissue and in the circulation of obese patients identifies novel metabolic biomarkers. J Clin Endocrinol Metab, 96(5), E846-850. doi:10.1210/jc.2010-2701
View at Publisher | View at Google Scholar - Hernandez-Perez, M., Chopra, G., Fine, J., Conteh, A. M., Anderson, R. M., Linnemann, A. K., . . . Mirmira, R. G. (2017). Inhibition of 12/15-Lipoxygenase Protects Against beta-Cell Oxidative Stress and Glycemic Deterioration in Mouse Models of Type 1 Diabetes. Diabetes, 66(11), 2875-2887. doi:10.2337/db17-0215
View at Publisher | View at Google Scholar - Hetz, C., Bernasconi, P., Fisher, J., Lee, A. H., Bassik, M. C., Antonsson, B., . . . Korsmeyer, S. J. (2006). Proapoptotic BAX and BAK modulate the unfolded protein response by a direct interaction with IRE1alpha. Science, 312(5773), 572-576. doi:10.1126/science.1123480
View at Publisher | View at Google Scholar - Ho, K. H., Chen, P. H., Hsi, E., Shih, C. M., Chang, W. C., Cheng, C. H., . . . Chen, K. C. (2017). Identification of IGF-1-enhanced cytokine expressions targeted by miR-181d in glioblastomas via an integrative miRNA/mRNA regulatory network analysis. Sci Rep, 7(1), 732. doi:10.1038/s41598-017-00826-0
View at Publisher | View at Google Scholar - Holvoet, P. (2012). Stress in obesity and associated metabolic and cardiovascular disorders. Scientifica (Cairo), 2012, 205027. doi:10.6064/2012/205027
View at Publisher | View at Google Scholar - Holvoet, P., Lee, D. H., Steffes, M., Gross, M., & Jacobs, D. R., Jr. (2008). Association between circulating oxidized low-density lipoprotein and incidence of the metabolic syndrome. JAMA, 299(19), 2287-2293. doi:10.1001/jama.299.19.2287
View at Publisher | View at Google Scholar - Hong, K., Xu, G., Grayson, T. B., & Shalev, A. (2016). Cytokines Regulate beta-Cell Thioredoxin-interacting Protein (TXNIP) via Distinct Mechanisms and Pathways. J Biol Chem, 291(16), 8428-8439. doi:10.1074/jbc.M115.698365
View at Publisher | View at Google Scholar - Houtkooper, R. H., Pirinen, E., & Auwerx, J. (2012). Sirtuins as regulators of metabolism and healthspan. Nat Rev Mol Cell Biol, 13(4), 225-238. doi:10.1038/nrm3293
View at Publisher | View at Google Scholar - Hsu, Y. H., Wu, C. H., Chiu, C. J., Chen, W. T., Chang, Y. C., Wabitsch, M., & Chang, M. S. (2021). IL-20 is involved in obesity by modulation of adipogenesis and macrophage dysregulation. Immunology, 164(4), 817-833. doi:10.1111/imm.13403
View at Publisher | View at Google Scholar - Hu, C., Bai, X., Liu, C., & Hu, Z. (2019). Long noncoding RNA XIST participates hypoxia-induced angiogenesis in human brain microvascular endothelial cells through regulating miR-485/SOX7 axis. Microcirculation. doi:10.1111/micc.12601
View at Publisher | View at Google Scholar - Huang, S. F., Zhao, G., Peng, X. F., & Ye, W. C. (2021). The Pathogenic Role of Long Non-coding RNA H19 in Atherosclerosis via the miR-146a-5p/ANGPTL4 Pathway. Front Cardiovasc Med, 8, 770163. doi:10.3389/fcvm.2021.770163
View at Publisher | View at Google Scholar - Hueso, M., Grinan, R., Mallen, A., Navarro, E., Purqueras, E., Goma, M., . . . Rotllan, N. (2022). MiR-125b downregulates macrophage scavenger receptor type B1 and reverse cholesterol transport. Biomed Pharmacother, 146, 112596. doi:10.1016/j.biopha.2021.112596
View at Publisher | View at Google Scholar - Hulsmans, M., Geeraert, B., De Keyzer, D., Mertens, A., Lannoo, M., Vanaudenaerde, B., . . . Holvoet, P. (2012). Interleukin-1 receptor-associated kinase-3 is a key inhibitor of inflammation in obesity and metabolic syndrome. PLoS One, 7(1), e30414. doi:10.1371/journal.pone.0030414
View at Publisher | View at Google Scholar - Hulsmans, M., Van Dooren, E., Mathieu, C., & Holvoet, P. (2012). Decrease of miR-146b-5p in monocytes during obesity is associated with loss of the anti-inflammatory but not insulin signaling action of adiponectin. PLoS One, 7(2), e32794. doi:10.1371/journal.pone.0032794
View at Publisher | View at Google Scholar - Hung, Y. H., Kanke, M., Kurtz, C. L., Cubitt, R. L., Bunaciu, R. P., Zhou, L., . . . Sethupathy, P. (2019). MiR-29 Regulates de novo Lipogenesis in the Liver and Circulating Triglyceride Levels in a Sirt1-Dependent Manner. Front Physiol, 10, 1367. doi:10.3389/fphys.2019.01367
View at Publisher | View at Google Scholar - Huo, X., Liu, S., Shao, T., Hua, H., Kong, Q., Wang, J., . . . Jiang, Y. (2014). GSK3 protein positively regulates type I insulin-like growth factor receptor through forkhead transcription factors FOXO1/3/4. J Biol Chem, 289(36), 24759-24770. doi:10.1074/jbc.M114.580738
View at Publisher | View at Google Scholar - Husseini, M., Wang, G. S., Patrick, C., Crookshank, J. A., MacFarlane, A. J., Noel, J. A., . . . Scott, F. W. (2015). Heme Oxygenase-1 Induction Prevents Autoimmune Diabetes in Association With Pancreatic Recruitment of M2-Like Macrophages, Mesenchymal Cells, and Fibrocytes. Endocrinology, 156(11), 3937-3949. doi:10.1210/en.2015-1304
View at Publisher | View at Google Scholar - Icli, B., Wu, W., Ozdemir, D., Li, H., Cheng, H. S., Haemmig, S., . . . Feinberg, M. W. (2019). MicroRNA-615-5p Regulates Angiogenesis and Tissue Repair by Targeting AKT/eNOS (Endothelial NO Synthase) Signaling in Endothelial Cells. Arterioscler Thromb Vasc Biol, ATVBAHA119312726. doi:10.1161/ATVBAHA.119.312726
View at Publisher | View at Google Scholar - Imai, S., & Kiess, W. (2009). Therapeutic potential of SIRT1 and NAMPT-mediated NAD biosynthesis in type 2 diabetes. Front Biosci (Landmark Ed), 14(8), 2983-2995. doi:10.2741/3428
View at Publisher | View at Google Scholar - Inomata, Y., Oh, J. W., Taniguchi, K., Sugito, N., Kawaguchi, N., Hirokawa, F., . . . Uchiyama, K. (2022). Downregulation of miR-122-5p Activates Glycolysis via PKM2 in Kupffer Cells of Rat and Mouse Models of Non-Alcoholic Steatohepatitis. Int J Mol Sci, 23(9). doi:10.3390/ijms23095230
View at Publisher | View at Google Scholar - Jia, C., Xiong, M., Wang, P., Cui, J., Du, X., Yang, Q., . . . Zhang, T. (2014). Notoginsenoside R1 attenuates atherosclerotic lesions in ApoE deficient mouse model. PLoS One, 9(6), e99849. doi:10.1371/journal.pone.0099849
View at Publisher | View at Google Scholar - Jiang, W., Liu, J., Dai, Y., Zhou, N., Ji, C., & Li, X. (2015). MiR-146b attenuates high-fat diet-induced non-alcoholic steatohepatitis in mice. J Gastroenterol Hepatol, 30(5), 933-943. doi:10.1111/jgh.12878
View at Publisher | View at Google Scholar - Jimenez Calvente, C., Del Pilar, H., Tameda, M., Johnson, C. D., & Feldstein, A. E. (2020). MicroRNA 223 3p Negatively Regulates the NLRP3 Inflammasome in Acute and Chronic Liver Injury. Mol Ther, 28(2), 653-663. doi:10.1016/j.ymthe.2019.09.013
View at Publisher | View at Google Scholar - Kanda, H., Tateya, S., Tamori, Y., Kotani, K., Hiasa, K., Kitazawa, R., . . . Kasuga, M. (2006). MCP-1 contributes to macrophage infiltration into adipose tissue, insulin resistance, and hepatic steatosis in obesity. J Clin Invest, 116(6), 1494-1505. doi:10.1172/JCI26498
View at Publisher | View at Google Scholar - Kang, M., Yan, L. M., Zhang, W. Y., Li, Y. M., Tang, A. Z., & Ou, H. S. (2013). Role of microRNA-21 in regulating 3T3-L1 adipocyte differentiation and adiponectin expression. Mol Biol Rep, 40(8), 5027-5034. doi:10.1007/s11033-013-2603-6
View at Publisher | View at Google Scholar - Kauppinen, A., Suuronen, T., Ojala, J., Kaarniranta, K., & Salminen, A. (2013). Antagonistic crosstalk between NF-kappaB and SIRT1 in the regulation of inflammation and metabolic disorders. Cell Signal, 25(10), 1939-1948. doi:10.1016/j.cellsig.2013.06.007
View at Publisher | View at Google Scholar - Kim, K. S., Lee, B. W., Kim, Y. J., Lee, D. H., Cha, B. S., & Park, C. Y. (2019). Nonalcoholic Fatty Liver Disease and Diabetes: Part II: Treatment. Diabetes Metab J, 43(2), 127-143. doi:10.4093/dmj.2019.0034
View at Publisher | View at Google Scholar - Kim, S., & Woo, C. H. (2018). Laminar Flow Inhibits ER Stress-Induced Endothelial Apoptosis through PI3K/Akt-Dependent Signaling Pathway. Mol Cells, 41(11), 964-970. doi:10.14348/molcells.2018.0111
View at Publisher | View at Google Scholar - Koh, E. H., Chernis, N., Saha, P. K., Xiao, L., Bader, D. A., Zhu, B., . . . Hartig, S. M. (2018). miR-30a Remodels Subcutaneous Adipose Tissue Inflammation to Improve Insulin Sensitivity in Obesity. Diabetes, 67(12), 2541-2553. doi:10.2337/db17-1378
View at Publisher | View at Google Scholar - Kohn, A. D., Summers, S. A., Birnbaum, M. J., & Roth, R. A. (1996). Expression of a constitutively active Akt Ser/Thr kinase in 3T3-L1 adipocytes stimulates glucose uptake and glucose transporter 4 translocation. J Biol Chem, 271(49), 31372-31378. Retrieved from https://www.ncbi.nlm.nih.gov/pubmed/8940145
View at Publisher | View at Google Scholar - Kondylis, V., Kumari, S., Vlantis, K., & Pasparakis, M. (2017). The interplay of IKK, NF-kappaB and RIPK1 signaling in the regulation of cell death, tissue homeostasis and inflammation. Immunol Rev, 277(1), 113-127. doi:10.1111/imr.12550
View at Publisher | View at Google Scholar - Kuehbacher, A., Urbich, C., Zeiher, A. M., & Dimmeler, S. (2007). Role of Dicer and Drosha for endothelial microRNA expression and angiogenesis. Circ Res, 101(1), 59-68. doi:10.1161/CIRCRESAHA.107.153916
View at Publisher | View at Google Scholar - Lazaro, I., Lopez-Sanz, L., Bernal, S., Oguiza, A., Recio, C., Melgar, A., . . . Gomez-Guerrero, C. (2018). Nrf2 Activation Provides Atheroprotection in Diabetic Mice Through Concerted Upregulation of Antioxidant, Anti-inflammatory, and Autophagy Mechanisms. Front Pharmacol, 9, 819. doi:10.3389/fphar.2018.00819
View at Publisher | View at Google Scholar - Lebeaupin, C., Vallee, D., Hazari, Y., Hetz, C., Chevet, E., & Bailly-Maitre, B. (2018). Endoplasmic reticulum stress signalling and the pathogenesis of non-alcoholic fatty liver disease. J Hepatol, 69(4), 927-947. doi:10.1016/j.jhep.2018.06.008
View at Publisher | View at Google Scholar - Lee, H. P., Lin, C. Y., Shih, J. S., Fong, Y. C., Wang, S. W., Li, T. M., & Tang, C. H. (2015). Adiponectin promotes VEGF-A-dependent angiogenesis in human chondrosarcoma through PI3K, Akt, mTOR, and HIF-alpha pathway. Oncotarget, 6(34), 36746-36761. doi:10.18632/oncotarget.5479
View at Publisher | View at Google Scholar - Leisegang, M. S., Fork, C., Josipovic, I., Richter, F. M., Preussner, J., Hu, J., . . . Brandes, R. P. (2017). Long Noncoding RNA MANTIS Facilitates Endothelial Angiogenic Function. Circulation, 136(1), 65-79. doi:10.1161/CIRCULATIONAHA.116.026991
View at Publisher | View at Google Scholar - Levy, D. E., & Darnell, J. E., Jr. (2002). Stats: transcriptional control and biological impact. Nat Rev Mol Cell Biol, 3(9), 651-662. doi:10.1038/nrm909
View at Publisher | View at Google Scholar - Li, C., Zhou, D., Hong, H., Yang, S., Zhang, L., Li, S., . . . Tang, H. (2019). TGFbeta1- miR-140-5p axis mediated up-regulation of Flap Endonuclease 1 promotes epithelial-mesenchymal transition in hepatocellular carcinoma. Aging (Albany NY), 11(15), 5593-5612. doi:10.18632/aging.102140
View at Publisher | View at Google Scholar - Li, D., Wang, X., Lan, X., Li, Y., Liu, L., Yi, J., . . . Lu, S. (2015). Down-regulation of miR-144 elicits proinflammatory cytokine production by targeting toll-like receptor 2 in nonalcoholic steatohepatitis of high-fat-diet-induced metabolic syndrome E3 rats. Mol Cell Endocrinol, 402, 1-12. doi:10.1016/j.mce.2014.12.007
View at Publisher | View at Google Scholar - Li, J., Li, S. X., Gao, X. H., Zhao, L. F., Du, J., Wang, T. Y., . . . Guo, Z. Y. (2019). HIF1A and VEGF regulate each other by competing endogenous RNA mechanism and involve in the pathogenesis of peritoneal fibrosis. Pathol Res Pract, 215(4), 644-652. doi:10.1016/j.prp.2018.12.022
View at Publisher | View at Google Scholar - Li, K., Ching, D., Luk, F. S., & Raffai, R. L. (2015). Apolipoprotein E enhances microRNA-146a in monocytes and macrophages to suppress nuclear factor-kappaB-driven inflammation and atherosclerosis. Circ Res, 117(1), e1-e11. doi:10.1161/CIRCRESAHA.117.305844
View at Publisher | View at Google Scholar - Li, X., Wang, S., Mu, W., Barry, J., Han, A., Carpenter, R. L., . . . He, J. (2022). Reactive oxygen species reprogram macrophages to suppress antitumor immune response through the exosomal miR-155-5p/PD-L1 pathway. J Exp Clin Cancer Res, 41(1), 41. doi:10.1186/s13046-022-02244-1
View at Publisher | View at Google Scholar - Li, Y., Chen, Z., Han, J., Ma, X., Zheng, X., & Chen, J. (2022). Functional and Therapeutic Significance of Tumor-Associated Macrophages in Colorectal Cancer. Front Oncol, 12, 781233. doi:10.3389/fonc.2022.781233
View at Publisher | View at Google Scholar - Li, Y., Luan, Y., Li, J., Song, H., Li, Y., Qi, H., . . . Yang, Y. (2020). Exosomal miR-199a-5p promotes hepatic lipid accumulation by modulating MST1 expression and fatty acid metabolism. Hepatol Int, 14(6), 1057-1074. doi:10.1007/s12072-020-10096-0
View at Publisher | View at Google Scholar - Li, Y., Luo, T., Wang, L., Wu, J., & Guo, S. (2016). MicroRNA-19a-3p enhances the proliferation and insulin secretion, while it inhibits the apoptosis of pancreatic beta cells via the inhibition of SOCS3. Int J Mol Med, 38(5), 1515-1524. doi:10.3892/ijmm.2016.2748
View at Publisher | View at Google Scholar - Li, Y., Shi, Y., McCaw, L., Li, Y. J., Zhu, F., Gorczynski, R., . . . Spaner, D. E. (2015). Microenvironmental interleukin-6 suppresses toll-like receptor signaling in human leukemia cells through miR-17/19A. Blood, 126(6), 766-778. doi:10.1182/blood-2014-12-618678
View at Publisher | View at Google Scholar - Li, Y., Zhao, L., Shi, B., Ma, S., Xu, Z., Ge, Y., . . . Shi, J. (2015). Functions of miR-146a and miR-222 in Tumor-associated Macrophages in Breast Cancer. Sci Rep, 5, 18648. doi:10.1038/srep18648
View at Publisher | View at Google Scholar - Liaskou, E., Zimmermann, H. W., Li, K. K., Oo, Y. H., Suresh, S., Stamataki, Z., . . . Adams, D. H. (2013). Monocyte subsets in human liver disease show distinct phenotypic and functional characteristics. Hepatology, 57(1), 385-398. doi:10.1002/hep.26016
View at Publisher | View at Google Scholar - Liu, C., Deng, J., Wang, S., & Ren, L. (2022). Hypoxia promotes epithelial-mesenchymal transition in lung cancer cells via regulating the NRF2/miR‑27a/BUB1 pathway. Clin Transl Oncol. doi:10.1007/s12094-022-02965-x
View at Publisher | View at Google Scholar - Liu, R., Sun, X., Hu, Z., Peng, C., & Wu, T. (2022). Knockdown of long non-coding RNA MIR155HG suppresses melanoma cell proliferation, and deregulated MIR155HG in melanoma is associated with M1/M2 balance and macrophage infiltration. Cells Dev, 170, 203768. doi:10.1016/j.cdev.2022.203768
View at Publisher | View at Google Scholar - Liu, X. L., Pan, Q., Cao, H. X., Xin, F. Z., Zhao, Z. H., Yang, R. X., . . . Fan, J. G. (2020). Lipotoxic Hepatocyte-Derived Exosomal MicroRNA 192-5p Activates Macrophages Through Rictor/Akt/Forkhead Box Transcription Factor O1 Signaling in Nonalcoholic Fatty Liver Disease. Hepatology, 72(2), 454-469. doi:10.1002/hep.31050
View at Publisher | View at Google Scholar - Liu, Y. S., Lin, H. Y., Lai, S. W., Huang, C. Y., Huang, B. R., Chen, P. Y., . . . Lu, D. Y. (2017). MiR-181b modulates EGFR-dependent VCAM-1 expression and monocyte adhesion in glioblastoma. Oncogene, 36(35), 5006-5022. doi:10.1038/onc.2017.129
View at Publisher | View at Google Scholar - Loomba, R., Friedman, S. L., & Shulman, G. I. (2021). Mechanisms and disease consequences of nonalcoholic fatty liver disease. Cell, 184(10), 2537-2564. doi:10.1016/j.cell.2021.04.015
View at Publisher | View at Google Scholar - Lu, Y., Qin, T., Li, J., Wang, L., Zhang, Q., Jiang, Z., & Mao, J. (2017). MicroRNA-140-5p inhibits invasion and angiogenesis through targeting VEGF-A in breast cancer. Cancer Gene Ther, 24(9), 386-392. doi:10.1038/cgt.2017.30
View at Publisher | View at Google Scholar - Luo, X. B., Li, L. T., Xi, J. C., Liu, H. T., Liu, Z., Yu, L., & Tang, P. F. (2022). Negative pressure promotes macrophage M1 polarization after Mycobacterium tuberculosis infection via the lncRNA XIST/microRNA-125b-5p/A20/NF-kappaB axis. Ann N Y Acad Sci, 1514(1), 116-131. doi:10.1111/nyas.14781
View at Publisher | View at Google Scholar - Luobu, Z., Wang, L., Jiang, D., Liao, T., Luobu, C., & Qunpei, L. (2022). CircSCAPER contributes to IL-1beta-induced osteoarthritis in vitro via miR-140-3p/EZH2 axis. Bone Joint Res, 11(2), 61-72. doi:10.1302/2046-3758.112.BJR-2020-0482.R2
View at Publisher | View at Google Scholar - Lv, Y., Liu, Z., Huang, J., Yu, J., Dong, Y., & Wang, J. (2020). LncRNA nuclear-enriched abundant transcript 1 regulates hypoxia-evoked apoptosis and autophagy via mediation of microRNA-181b. Mol Cell Biochem, 464(1-2), 193-203. doi:10.1007/s11010-019-03660-2
View at Publisher | View at Google Scholar - Ma, J., Chen, S., Liu, Y., Han, H., Gong, M., & Song, Y. (2022). The role of exosomal miR-181b in the crosstalk between NSCLC cells and tumor-associated macrophages. Genes Genomics, 44(10), 1243-1258. doi:10.1007/s13258-022-01227-y
View at Publisher | View at Google Scholar - Ma, S., Liu, M., Xu, Z., Li, Y., Guo, H., Ge, Y., . . . Shi, J. (2016). A double feedback loop mediated by microRNA-23a/27a/24-2 regulates M1 versus M2 macrophage polarization and thus regulates cancer progression. Oncotarget, 7(12), 13502-13519. doi:10.18632/oncotarget.6284
View at Publisher | View at Google Scholar - Maehama, T., & Dixon, J. E. (1999). PTEN: a tumour suppressor that functions as a phospholipid phosphatase. Trends Cell Biol, 9(4), 125-128. Retrieved from https://www.ncbi.nlm.nih.gov/pubmed/10203785
View at Publisher | View at Google Scholar - Mansouri, A., Gattolliat, C. H., & Asselah, T. (2018). Mitochondrial Dysfunction and Signaling in Chronic Liver Diseases. Gastroenterology, 155(3), 629-647. doi:10.1053/j.gastro.2018.06.083
View at Publisher | View at Google Scholar - Mantovani, A., Sozzani, S., Locati, M., Allavena, P., & Sica, A. (2002). Macrophage polarization: tumor-associated macrophages as a paradigm for polarized M2 mononuclear phagocytes. Trends Immunol, 23(11), 549-555. Retrieved from https://www.ncbi.nlm.nih.gov/pubmed/12401408
View at Publisher | View at Google Scholar - Mardente, S., Mari, E., Consorti, F., Di Gioia, C., Negri, R., Etna, M., . . . Antonaci, A. (2012). HMGB1 induces the overexpression of miR-222 and miR-221 and increases growth and motility in papillary thyroid cancer cells. Oncol Rep, 28(6), 2285-2289. doi:10.3892/or.2012.2058
View at Publisher | View at Google Scholar - Martin, S., Slot, J. W., & James, D. E. (1999). GLUT4 trafficking in insulin-sensitive cells. A morphological review. Cell Biochem Biophys, 30(1), 89-113. doi:10.1007/BF02737886
View at Publisher | View at Google Scholar - Martinez, F. O., Helming, L., & Gordon, S. (2009). Alternative activation of macrophages: an immunologic functional perspective. Annu Rev Immunol, 27, 451-483. doi:10.1146/annurev.immunol.021908.132532
View at Publisher | View at Google Scholar - Masson, S., Batkai, S., Beermann, J., Bar, C., Pfanne, A., Thum, S., . . . Thum, T. (2018). Circulating microRNA-132 levels improve risk prediction for heart failure hospitalization in patients with chronic heart failure. Eur J Heart Fail, 20(1), 78-85. doi:10.1002/ejhf.961
View at Publisher | View at Google Scholar - Meerson, A., Traurig, M., Ossowski, V., Fleming, J. M., Mullins, M., & Baier, L. J. (2013). Human adipose microRNA-221 is upregulated in obesity and affects fat metabolism downstream of leptin and TNF-alpha. Diabetologia, 56(9), 1971-1979. doi:10.1007/s00125-013-2950-9
View at Publisher | View at Google Scholar - Menendez-Castro, C., Cordasic, N., Neureiter, D., Amann, K., Marek, I., Volkert, G., . . . Hartner, A. (2015). Under-expression of alpha8 integrin aggravates experimental atherosclerosis. J Pathol, 236(1), 5-16. doi:10.1002/path.4501
View at Publisher | View at Google Scholar - Michalik, K. M., You, X., Manavski, Y., Doddaballapur, A., Zornig, M., Braun, T., . . . Dimmeler, S. (2014). Long noncoding RNA MALAT1 regulates endothelial cell function and vessel growth. Circ Res, 114(9), 1389-1397. doi:10.1161/CIRCRESAHA.114.303265
View at Publisher | View at Google Scholar - Moradi-Chaleshtori, M., Bandehpour, M., Soudi, S., Mohammadi-Yeganeh, S., & Hashemi, S. M. (2021). In vitro and in vivo evaluation of anti-tumoral effect of M1 phenotype induction in macrophages by miR-130 and miR-33 containing exosomes. Cancer Immunol Immunother, 70(5), 1323-1339. doi:10.1007/s00262-020-02762-x
View at Publisher | View at Google Scholar - Murria Estal, R., de Unamuno Bustos, B., Perez Simo, G., Simarro Farinos, J., Torres Navarro, I., Alegre de Miquel, V., . . . Botella Estrada, R. (2021). MicroRNAs expression associated with aggressive clinicopathological features and poor prognosis in primary cutaneous melanomas. Melanoma Res, 31(1), 18-26. doi:10.1097/CMR.0000000000000709
View at Publisher | View at Google Scholar - Murshid, A., Borges, T. J., Lang, B. J., & Calderwood, S. K. (2016). The Scavenger Receptor SREC-I Cooperates with Toll-Like Receptors to Trigger Inflammatory Innate Immune Responses. Front Immunol, 7, 226. doi:10.3389/fimmu.2016.00226
View at Publisher | View at Google Scholar - Nackiewicz, D., Dan, M., He, W., Kim, R., Salmi, A., Rutti, S., . . . Ehses, J. A. (2014). TLR2/6 and TLR4-activated macrophages contribute to islet inflammation and impair beta cell insulin gene expression via IL-1 and IL-6. Diabetologia, 57(8), 1645-1654. doi:10.1007/s00125-014-3249-1
View at Publisher | View at Google Scholar - Nakao, K., Miyaaki, H., & Ichikawa, T. (2014). Antitumor function of microRNA-122 against hepatocellular carcinoma. J Gastroenterol, 49(4), 589-593. doi:10.1007/s00535-014-0932-4
View at Publisher | View at Google Scholar - Natarajan, S. K., Stringham, B. A., Mohr, A. M., Wehrkamp, C. J., Lu, S., Phillippi, M. A., . . . Mott, J. L. (2017). FoxO3 increases miR-34a to cause palmitate-induced cholangiocyte lipoapoptosis. J Lipid Res, 58(5), 866-875. doi:10.1194/jlr.M071357
View at Publisher | View at Google Scholar - Orsini, M., Chateauvieux, S., Rhim, J., Gaigneaux, A., Cheillan, D., Christov, C., . . . Diederich, M. (2019). Sphingolipid-mediated inflammatory signaling leading to autophagy inhibition converts erythropoiesis to myelopoiesis in human hematopoietic stem/progenitor cells. Cell Death Differ, 26(9), 1796-1812. doi:10.1038/s41418-018-0245-x
View at Publisher | View at Google Scholar - Pan, J. X. (2017). LncRNA H19 promotes atherosclerosis by regulating MAPK and NF-kB signaling pathway. Eur Rev Med Pharmacol Sci, 21(2), 322-328. Retrieved from https://www.ncbi.nlm.nih.gov/pubmed/28165553
View at Publisher | View at Google Scholar - Parayath, N. N., Hong, B. V., Mackenzie, G. G., & Amiji, M. M. (2021). Hyaluronic acid nanoparticle-encapsulated microRNA-125b repolarizes tumor-associated macrophages in pancreatic cancer. Nanomedicine (Lond), 16(25), 2291-2303. doi:10.2217/nnm-2021-0080
View at Publisher | View at Google Scholar - Park, G. B., Jeong, J. Y., & Kim, D. (2020). GLUT5 regulation by AKT1/3-miR-125b-5p downregulation induces migratory activity and drug resistance in TLR-modified colorectal cancer cells. Carcinogenesis, 41(10), 1329-1340. doi:10.1093/carcin/bgaa074
View at Publisher | View at Google Scholar - Pena-Cano, M. I., Saucedo, R., Morales-Avila, E., Valencia, J., Zavala-Moha, J. A., & Lopez, A. (2019). Deregulated microRNAs and Adiponectin in Postmenopausal Women with Breast Cancer. Gynecol Obstet Invest, 84(4), 369-377. doi:10.1159/000496340
View at Publisher | View at Google Scholar - Peng, J., Wu, Y., Deng, Z., Zhou, Y., Song, T., Yang, Y., . . . Peng, J. (2017). MiR-377 promotes white adipose tissue inflammation and decreases insulin sensitivity in obesity via suppression of sirtuin-1 (SIRT1). Oncotarget, 8(41), 70550-70563. doi:10.18632/oncotarget.19742
View at Publisher | View at Google Scholar - Peng, J., Zhou, Y., Deng, Z., Zhang, H., Wu, Y., Song, T., . . . Peng, J. (2017). miR-221 negatively regulates inflammation and insulin sensitivity in white adipose tissue by repression of sirtuin-1 (SIRT1). J Cell Biochem. doi:10.1002/jcb.26589
View at Publisher | View at Google Scholar - Peta, E., Sinigaglia, A., Masi, G., Di Camillo, B., Grassi, A., Trevisan, M., . . . Barzon, L. (2018). HPV16 E6 and E7 upregulate the histone lysine demethylase KDM2B through the c-MYC/miR-146a-5p axys. Oncogene, 37(12), 1654-1668. doi:10.1038/s41388-017-0083-1
View at Publisher | View at Google Scholar - Phu, T. A., Ng, M., Vu, N. K., Bouchareychas, L., & Raffai, R. L. (2022). IL-4 polarized human macrophage exosomes control cardiometabolic inflammation and diabetes in obesity. Mol Ther, 30(6), 2274-2297. doi:10.1016/j.ymthe.2022.03.008
View at Publisher | View at Google Scholar - Poitz, D. M., Augstein, A., Gradehand, C., Ende, G., Schmeisser, A., & Strasser, R. H. (2013). Regulation of the Hif-system by micro-RNA 17 and 20a - role during monocyte-to-macrophage differentiation. Mol Immunol, 56(4), 442-451. doi:10.1016/j.molimm.2013.06.014
View at Publisher | View at Google Scholar - Qian, B., Yang, Y., Tang, N., Wang, J., Sun, P., Yang, N., . . . Han, X. (2021). M1 macrophage-derived exosomes impair beta cell insulin secretion via miR-212-5p by targeting SIRT2 and inhibiting Akt/GSK-3beta/beta-catenin pathway in mice. Diabetologia, 64(9), 2037-2051. doi:10.1007/s00125-021-05489-1
View at Publisher | View at Google Scholar - Qin, W., Chung, A. C., Huang, X. R., Meng, X. M., Hui, D. S., Yu, C. M., . . . Lan, H. Y. (2011). TGF-beta/Smad3 signaling promotes renal fibrosis by inhibiting miR-29. J Am Soc Nephrol, 22(8), 1462-1474. doi:10.1681/ASN.2010121308
View at Publisher | View at Google Scholar - Qiu, G. Z., Tian, W., Fu, H. T., Li, C. P., & Liu, B. (2016). Long noncoding RNA-MEG3 is involved in diabetes mellitus-related microvascular dysfunction. Biochem Biophys Res Commun, 471(1), 135-141. doi:10.1016/j.bbrc.2016.01.164
View at Publisher | View at Google Scholar - Rafiei, A., Ferns, G. A., Ahmadi, R., Khaledifar, A., Rahimzadeh-Fallah, T., Mohmmad-Rezaei, M., . . . Bagheri, N. (2021). Expression levels of miR-27a, miR-329, ABCA1, and ABCG1 genes in peripheral blood mononuclear cells and their correlation with serum levels of oxidative stress and hs-CRP in the patients with coronary artery disease. IUBMB Life, 73(1), 223-237. doi:10.1002/iub.2421
View at Publisher | View at Google Scholar - Ranjbar, R., Hesari, A., Ghasemi, F., & Sahebkar, A. (2018). Expression of microRNAs and IRAK1 pathway genes are altered in gastric cancer patients with Helicobacter pylori infection. J Cell Biochem, 119(9), 7570-7576. doi:10.1002/jcb.27067
View at Publisher | View at Google Scholar - Ren, H., Shao, Y., Wu, C., Ma, X., Lv, C., & Wang, Q. (2020). Metformin alleviates oxidative stress and enhances autophagy in diabetic kidney disease via AMPK/SIRT1-FoxO1 pathway. Mol Cell Endocrinol, 500, 110628. doi:10.1016/j.mce.2019.110628
View at Publisher | View at Google Scholar - Ren, W., Xi, G., Li, X., Zhao, L., Yang, K., Fan, X., . . . Guo, J. (2021). Long non-coding RNA HCG18 promotes M1 macrophage polarization through regulating the miR-146a/TRAF6 axis, facilitating the progression of diabetic peripheral neuropathy. Mol Cell Biochem, 476(1), 471-482. doi:10.1007/s11010-020-03923-3
View at Publisher | View at Google Scholar - Rendra, E., Riabov, V., Mossel, D. M., Sevastyanova, T., Harmsen, M. C., & Kzhyshkowska, J. (2019). Reactive oxygen species (ROS) in macrophage activation and function in diabetes. Immunobiology, 224(2), 242-253. doi:10.1016/j.imbio.2018.11.010
View at Publisher | View at Google Scholar - Resnick, N., Yahav, H., Shay-Salit, A., Shushy, M., Schubert, S., Zilberman, L. C., & Wofovitz, E. (2003). Fluid shear stress and the vascular endothelium: for better and for worse. Prog Biophys Mol Biol, 81(3), 177-199. Retrieved from https://www.ncbi.nlm.nih.gov/pubmed/12732261
View at Publisher | View at Google Scholar - Rhee, S. D., Sung, Y. Y., Jung, W. H., & Cheon, H. G. (2008). Leptin inhibits rosiglitazone-induced adipogenesis in murine primary adipocytes. Mol Cell Endocrinol, 294(1-2), 61-69. doi:10.1016/j.mce.2008.08.018
View at Publisher | View at Google Scholar - Riahi, Y., Israeli, T., Yeroslaviz, R., Chimenez, S., Avrahami, D., Stolovich-Rain, M., . . . Leibowitz, G. (2018). Inhibition of mTORC1 by ER stress impairs neonatal beta-cell expansion and predisposes to diabetes in the Akita mouse. Elife, 7. doi:10.7554/eLife.38472
View at Publisher | View at Google Scholar - Rodrigues, P. M., Afonso, M. B., Simao, A. L., Carvalho, C. C., Trindade, A., Duarte, A., . . . Castro, R. E. (2017). miR-21 ablation and obeticholic acid ameliorate nonalcoholic steatohepatitis in mice. Cell Death Dis, 8(4), e2748. doi:10.1038/cddis.2017.172
View at Publisher | View at Google Scholar - Rosjo, H., Dahl, M. B., Bye, A., Andreassen, J., Jorgensen, M., Wisloff, U., . . . Omland, T. (2014). Prognostic value of circulating microRNA-210 levels in patients with moderate to severe aortic stenosis. PLoS One, 9(3), e91812. doi:10.1371/journal.pone.0091812
View at Publisher | View at Google Scholar - Rutti, S., Howald, C., Arous, C., Dermitzakis, E., Halban, P. A., & Bouzakri, K. (2016). IL-13 improves beta-cell survival and protects against IL-1beta-induced beta-cell death. Mol Metab, 5(2), 122-131. doi:10.1016/j.molmet.2015.11.003
View at Publisher | View at Google Scholar - Salvatori, B., Iosue, I., Djodji Damas, N., Mangiavacchi, A., Chiaretti, S., Messina, M., . . . Fatica, A. (2011). Critical Role of c-Myc in Acute Myeloid Leukemia Involving Direct Regulation of miR-26a and Histone Methyltransferase EZH2. Genes Cancer, 2(5), 585-592. doi:10.1177/1947601911416357
View at Publisher | View at Google Scholar - Samala, N., Tersey, S. A., Chalasani, N., Anderson, R. M., & Mirmira, R. G. (2017). Molecular mechanisms of nonalcoholic fatty liver disease: Potential role for 12-lipoxygenase. J Diabetes Complications, 31(11), 1630-1637. doi:10.1016/j.jdiacomp.2017.07.014
View at Publisher | View at Google Scholar - Sander, S., Bullinger, L., Klapproth, K., Fiedler, K., Kestler, H. A., Barth, T. F., . . . Wirth, T. (2008). MYC stimulates EZH2 expression by repression of its negative regulator miR-26a. Blood, 112(10), 4202-4212. doi:10.1182/blood-2008-03-147645
View at Publisher | View at Google Scholar - Seeley, J. J., Baker, R. G., Mohamed, G., Bruns, T., Hayden, M. S., Deshmukh, S. D., . . . Ghosh, S. (2018). Induction of innate immune memory via microRNA targeting of chromatin remodelling factors. Nature, 559(7712), 114-119. doi:10.1038/s41586-018-0253-5
View at Publisher | View at Google Scholar - Sharma, B. R., & Kanneganti, T. D. (2021). NLRP3 inflammasome in cancer and metabolic diseases. Nat Immunol, 22(5), 550-559. doi:10.1038/s41590-021-00886-5
View at Publisher | View at Google Scholar - Sharma, P. M., Egawa, K., Huang, Y., Martin, J. L., Huvar, I., Boss, G. R., & Olefsky, J. M. (1998). Inhibition of phosphatidylinositol 3-kinase activity by adenovirus-mediated gene transfer and its effect on insulin action. J Biol Chem, 273(29), 18528-18537. Retrieved from https://www.ncbi.nlm.nih.gov/pubmed/9660823
View at Publisher | View at Google Scholar - Shen, M., Yu, H., Jin, Y., Mo, J., Sui, J., Qian, X., & Chen, T. (2022). Metformin Facilitates Osteoblastic Differentiation and M2 Macrophage Polarization by PI3K/AKT/mTOR Pathway in Human Umbilical Cord Mesenchymal Stem Cells. Stem Cells Int, 2022, 9498876. doi:10.1155/2022/9498876
View at Publisher | View at Google Scholar - Shen, X., Guo, H., Xu, J., & Wang, J. (2019). Inhibition of lncRNA HULC improves hepatic fibrosis and hepatocyte apoptosis by inhibiting the MAPK signaling pathway in rats with nonalcoholic fatty liver disease. J Cell Physiol. doi:10.1002/jcp.28450
View at Publisher | View at Google Scholar - Shepherd, P. R., & Kahn, B. B. (1999). Glucose transporters and insulin action--implications for insulin resistance and diabetes mellitus. N Engl J Med, 341(4), 248-257. doi:10.1056/NEJM199907223410406
View at Publisher | View at Google Scholar - Shi, X., Ma, W., Li, Y., Wang, H., Pan, S., Tian, Y., . . . Li, L. (2020). MiR-144-5p limits experimental abdominal aortic aneurysm formation by mitigating M1 macrophage-associated inflammation: Suppression of TLR2 and OLR1. J Mol Cell Cardiol, 143, 1-14. doi:10.1016/j.yjmcc.2020.04.008
View at Publisher | View at Google Scholar - Sica, A., & Mantovani, A. (2012). Macrophage plasticity and polarization: in vivo veritas. J Clin Invest, 122(3), 787-795. doi:10.1172/JCI59643
View at Publisher | View at Google Scholar - Song, C. L., Liu, B., Shi, Y. F., Liu, N., Yan, Y. Y., Zhang, J. C., . . . Wu, J. D. (2016). MicroRNA-130a alleviates human coronary artery endothelial cell injury and inflammatory responses by targeting PTEN via activating PI3K/Akt/eNOS signaling pathway. Oncotarget, 7(44), 71922-71936. doi:10.18632/oncotarget.12431
View at Publisher | View at Google Scholar - Song, F., Li, J. Z., Wu, Y., Wu, W. Y., Wang, Y., & Li, G. (2021). Ubiquitinated ligation protein NEDD4L participates in MiR-30a-5p attenuated atherosclerosis by regulating macrophage polarization and lipid metabolism. Mol Ther Nucleic Acids, 26, 1303-1317. doi:10.1016/j.omtn.2021.10.030
View at Publisher | View at Google Scholar - Song, J., Xu, X., He, S., Wang, N., Bai, Y., Li, B., & Zhang, S. (2022). Exosomal hsa_circ_0017252 attenuates the development of gastric cancer via inhibiting macrophage M2 polarization. Hum Cell, 35(5), 1499-1511. doi:10.1007/s13577-022-00739-9
View at Publisher | View at Google Scholar - Stahl, E. C., Haschak, M. J., Popovic, B., & Brown, B. N. (2018). Macrophages in the Aging Liver and Age-Related Liver Disease. Front Immunol, 9, 2795. doi:10.3389/fimmu.2018.02795
View at Publisher | View at Google Scholar - Sun, J., Huang, Q., Li, S., Meng, F., Li, X., & Gong, X. (2018). miR-330-5p/Tim-3 axis regulates macrophage M2 polarization and insulin resistance in diabetes mice. Mol Immunol, 95, 107-113. doi:10.1016/j.molimm.2018.02.006
View at Publisher | View at Google Scholar - Sun, X., Lin, J., Zhang, Y., Kang, S., Belkin, N., Wara, A. K., . . . Feinberg, M. W. (2016). MicroRNA-181b Improves Glucose Homeostasis and Insulin Sensitivity by Regulating Endothelial Function in White Adipose Tissue. Circ Res, 118(5), 810-821. doi:10.1161/CIRCRESAHA.115.308166
View at Publisher | View at Google Scholar - Sun, Y., Zhou, Y., Shi, Y., Zhang, Y., Liu, K., Liang, R., . . . Han, X. (2021). Expression of miRNA-29 in Pancreatic beta Cells Promotes Inflammation and Diabetes via TRAF3. Cell Rep, 34(1), 108576. doi:10.1016/j.celrep.2020.108576
View at Publisher | View at Google Scholar - Takahashi, K., Satoh, M., Takahashi, Y., Osaki, T., Nasu, T., Tamada, M., . . . Morino, Y. (2016). Dysregulation of ossification-related miRNAs in circulating osteogenic progenitor cells obtained from patients with aortic stenosis. Clin Sci (Lond), 130(13), 1115-1124. doi:10.1042/CS20160094
View at Publisher | View at Google Scholar - Tang, S., Zhu, W., Zheng, F., Gui, W., Zhang, W., Lin, X., & Li, H. (2020). The Long Noncoding RNA Blnc1 Protects Against Diet-Induced Obesity by Promoting Mitochondrial Function in White Fat. Diabetes Metab Syndr Obes, 13, 1189-1201. doi:10.2147/DMSO.S248692
View at Publisher | View at Google Scholar - Tardif, G., Pelletier, J. P., Fahmi, H., Hum, D., Zhang, Y., Kapoor, M., & Martel-Pelletier, J. (2013). NFAT3 and TGF-beta/SMAD3 regulate the expression of miR-140 in osteoarthritis. Arthritis Res Ther, 15(6), R197. doi:10.1186/ar4387
View at Publisher | View at Google Scholar - Thomas, D., & Apovian, C. (2017). Macrophage functions in lean and obese adipose tissue. Metabolism, 72, 120-143. doi:10.1016/j.metabol.2017.04.005
View at Publisher | View at Google Scholar - Thulin, P., Wei, T., Werngren, O., Cheung, L., Fisher, R. M., Grander, D., . . . Ehrenborg, E. (2013). MicroRNA-9 regulates the expression of peroxisome proliferator-activated receptor delta in human monocytes during the inflammatory response. Int J Mol Med, 31(5), 1003-1010. doi:10.3892/ijmm.2013.1311
View at Publisher | View at Google Scholar - Tong, F., Mao, X., Zhang, S., Xie, H., Yan, B., Wang, B., . . . Wei, L. (2020). HPV + HNSCC-derived exosomal miR-9 induces macrophage M1 polarization and increases tumor radiosensitivity. Cancer Lett, 478, 34-44. doi:10.1016/j.canlet.2020.02.037
View at Publisher | View at Google Scholar - Tran, M., Lee, S. M., Shin, D. J., & Wang, L. (2017). Loss of miR-141/200c ameliorates hepatic steatosis and inflammation by reprogramming multiple signaling pathways in NASH. JCI Insight, 2(21). doi:10.1172/jci.insight.96094
View at Publisher | View at Google Scholar - Tsunekawa, S., Demozay, D., Briaud, I., McCuaig, J., Accili, D., Stein, R., & Rhodes, C. J. (2011). FoxO feedback control of basal IRS-2 expression in pancreatic beta-cells is distinct from that in hepatocytes. Diabetes, 60(11), 2883-2891. doi:10.2337/db11-0340
View at Publisher | View at Google Scholar - Tu, X., Zhang, Y., Zheng, X., Deng, J., Li, H., Kang, Z., . . . Zhang, J. (2017). TGF-beta-induced hepatocyte lincRNA-p21 contributes to liver fibrosis in mice. Sci Rep, 7(1), 2957. doi:10.1038/s41598-017-03175-0
View at Publisher | View at Google Scholar - Ueki, K., Kondo, T., & Kahn, C. R. (2004). Suppressor of cytokine signaling 1 (SOCS-1) and SOCS-3 cause insulin resistance through inhibition of tyrosine phosphorylation of insulin receptor substrate proteins by discrete mechanisms. Mol Cell Biol, 24(12), 5434-5446. doi:10.1128/MCB.24.12.5434-5446.2004
View at Publisher | View at Google Scholar - van 't Veer, C., van den Pangaart, P. S., van Zoelen, M. A., de Kruif, M., Birjmohun, R. S., Stroes, E. S., . . . van der Poll, T. (2007). Induction of IRAK-M is associated with lipopolysaccharide tolerance in a human endotoxemia model. J Immunol, 179(10), 7110-7120. Retrieved from https://www.ncbi.nlm.nih.gov/pubmed/17982103
View at Publisher | View at Google Scholar - Van Berkel, T. J., Van Eck, M., Herijgers, N., Fluiter, K., & Nion, S. (2000). Scavenger receptor classes A and B. Their roles in atherogenesis and the metabolism of modified LDL and HDL. Ann N Y Acad Sci, 902, 113-126; discussion 126-117. doi:10.1111/j.1749-6632.2000.tb06306.x
View at Publisher | View at Google Scholar - Van Eck, M., Pennings, M., Hoekstra, M., Out, R., & Van Berkel, T. J. (2005). Scavenger receptor BI and ATP-binding cassette transporter A1 in reverse cholesterol transport and atherosclerosis. Curr Opin Lipidol, 16(3), 307-315. doi:10.1097/01.mol.0000169351.28019.04
View at Publisher | View at Google Scholar - Vergadi, E., Ieronymaki, E., Lyroni, K., Vaporidi, K., & Tsatsanis, C. (2017). Akt Signaling Pathway in Macrophage Activation and M1/M2 Polarization. J Immunol, 198(3), 1006-1014. doi:10.4049/jimmunol.1601515
View at Publisher | View at Google Scholar - Viola, A., Munari, F., Sanchez-Rodriguez, R., Scolaro, T., & Castegna, A. (2019). The Metabolic Signature of Macrophage Responses. Front Immunol, 10, 1462. doi:10.3389/fimmu.2019.01462
View at Publisher | View at Google Scholar - Wang, B., Li, X., Hu, W., Zhou, Y., & Din, Y. (2019). Silencing of lncRNA SNHG20 delays the progression of nonalcoholic fatty liver disease to hepatocellular carcinoma via regulating liver Kupffer cells polarization. IUBMB Life, 71(12), 1952-1961. doi:10.1002/iub.2137
View at Publisher | View at Google Scholar - Wang, J., Yang, W., Chen, Z., Chen, J., Meng, Y., Feng, B., . . . Yang, J. (2018). Long Noncoding RNA lncSHGL Recruits hnRNPA1 to Suppress Hepatic Gluconeogenesis and Lipogenesis. Diabetes, 67(4), 581-593. doi:10.2337/db17-0799
View at Publisher | View at Google Scholar - Wang, S., Han, X., Mao, Z., Xin, Y., Maharjan, S., & Zhang, B. (2019). MALAT1 lncRNA Induces Autophagy and Protects Brain Microvascular Endothelial Cells Against Oxygen-Glucose Deprivation by Binding to miR-200c-3p and Upregulating SIRT1 Expression. Neuroscience, 397, 116-126. doi:10.1016/j.neuroscience.2018.11.024
View at Publisher | View at Google Scholar - Wang, X., Zhao, H., Wang, P., Zhang, J., Li, N., Liu, Y., . . . Yu, Y. (2022). MiR-30a-5p/CHD1 axis enhances cisplatin sensitivity of ovarian cancer cells via inactivating the Wnt/beta-catenin pathway. Anticancer Drugs, 33(10), 989-998. doi:10.1097/CAD.0000000000001397
View at Publisher | View at Google Scholar - Wang, Y., Fang, J., & Gu, F. (2022). MiR-125b-5p/TPD52 Axis Affects Proliferation, Migration and Invasion of Breast Cancer Cells. Mol Biotechnol, 64(9), 1003-1012. doi:10.1007/s12033-022-00475-3
View at Publisher | View at Google Scholar - Wang, Y., Qiu, Z., Yuan, J., Li, C., Zhao, R., Liu, W., . . . Shi, B. (2021). Hypoxia-reoxygenation induces macrophage polarization and causes the release of exosomal miR-29a to mediate cardiomyocyte pyroptosis. In Vitro Cell Dev Biol Anim, 57(1), 30-41. doi:10.1007/s11626-020-00524-8
View at Publisher | View at Google Scholar - Wang, Z., Filgueiras, L. R., Wang, S., Serezani, A. P., Peters-Golden, M., Jancar, S., & Serezani, C. H. (2014). Leukotriene B4 enhances the generation of proinflammatory microRNAs to promote MyD88-dependent macrophage activation. J Immunol, 192(5), 2349-2356. doi:10.4049/jimmunol.1302982
View at Publisher | View at Google Scholar - Wang, Z., Li, C., Sun, X., Li, Z., Li, J., Wang, L., & Sun, Y. (2020). Hypermethylation of miR-181b in monocytes is associated with coronary artery disease and promotes M1 polarized phenotype via PIAS1-KLF4 axis. Cardiovasc Diagn Ther, 10(4), 738-751. doi:10.21037/cdt-20-407
View at Publisher | View at Google Scholar - Wang, Z., Sun, W., Li, R., & Liu, Y. (2022). miRNA-93-5p in exosomes derived from M2 macrophages improves lipopolysaccharide-induced podocyte apoptosis by targeting Toll-like receptor 4. Bioengineered, 13(3), 7683-7696. doi:10.1080/21655979.2021.2023794
View at Publisher | View at Google Scholar - Wang, Z., Zhu, H., Shi, H., Zhao, H., Gao, R., Weng, X., . . . Ge, J. (2019). Exosomes derived from M1 macrophages aggravate neointimal hyperplasia following carotid artery injuries in mice through miR-222/CDKN1B/CDKN1C pathway. Cell Death Dis, 10(6), 422. doi:10.1038/s41419-019-1667-1
View at Publisher | View at Google Scholar - Whitehead, J. P., Richards, A. A., Hickman, I. J., Macdonald, G. A., & Prins, J. B. (2006). Adiponectin--a key adipokine in the metabolic syndrome. Diabetes Obes Metab, 8(3), 264-280. doi:10.1111/j.1463-1326.2005.00510.x
View at Publisher | View at Google Scholar - Wijesekara, N., Zhang, L. H., Kang, M. H., Abraham, T., Bhattacharjee, A., Warnock, G. L., . . . Hayden, M. R. (2012). miR-33a modulates ABCA1 expression, cholesterol accumulation, and insulin secretion in pancreatic islets. Diabetes, 61(3), 653-658. doi:10.2337/db11-0944
View at Publisher | View at Google Scholar - Wu, J., Liang, W., Tian, Y., Ma, F., Huang, W., Jia, Y., . . . Wu, H. (2019). Inhibition of P53/miR-34a improves diabetic endothelial dysfunction via activation of SIRT1. J Cell Mol Med, 23(5), 3538-3548. doi:10.1111/jcmm.14253
View at Publisher | View at Google Scholar - Wu, S., Xu, R., Zhu, X., He, H., Zhang, J., Zeng, Q., . . . Zhao, X. (2020). The long noncoding RNA LINC01140/miR-140-5p/FGF9 axis modulates bladder cancer cell aggressiveness and macrophage M2 polarization. Aging (Albany NY), 12(24), 25845-25864. doi:10.18632/aging.202147
View at Publisher | View at Google Scholar - Wu, X., Wang, Y., Chen, C., Xue, Y., Zheng, S., & Cai, L. (2022). Hsa-let-7c-5p, hsa-miR-130b-3p, and hsa-miR-142-3p as Novel miRNA Biomarkers for Melanoma Progression. Genet Res (Camb), 2022, 5671562. doi:10.1155/2022/5671562
View at Publisher | View at Google Scholar - Wu, X., Zheng, X., Cheng, J., Zhang, K., & Ma, C. (2020). LncRNA TUG1 regulates proliferation and apoptosis by regulating miR-148b/IGF2 axis in ox-LDL-stimulated VSMC and HUVEC. Life Sci, 243, 117287. doi:10.1016/j.lfs.2020.117287
View at Publisher | View at Google Scholar - Wu, Y., Ye, J., Guo, R., Liang, X., & Yang, L. (2018). TRIF Regulates BIC/miR-155 via the ERK Signaling Pathway to Control the ox-LDL-Induced Macrophage Inflammatory Response. J Immunol Res, 2018, 6249085. doi:10.1155/2018/6249085
View at Publisher | View at Google Scholar - Xia, X., Wang, D., Yu, L., Wang, B., Wang, W., Jiao, C., . . . Feng, J. (2021). Activated M1 macrophages suppress c-kit expression via TNF-alpha-mediated upregulation of miR-222 in Neonatal Necrotizing Enterocolitis. Inflamm Res, 70(3), 343-358. doi:10.1007/s00011-021-01441-6
View at Publisher | View at Google Scholar - Xie, M., Wang, J., Gong, W., Xu, H., Pan, X., Chen, Y., . . . Shao, Q. (2019). NF-kappaB-driven miR-34a impairs Treg/Th17 balance via targeting Foxp3. J Autoimmun, 102, 96-113. doi:10.1016/j.jaut.2019.04.018
View at Publisher | View at Google Scholar - Xu, C. G., Yang, M. F., Fan, J. X., & Wang, W. (2016). MiR-30a and miR-205 are downregulated in hypoxia and modulate radiosensitivity of prostate cancer cells by inhibiting autophagy via TP53INP1. Eur Rev Med Pharmacol Sci, 20(8), 1501-1508. Retrieved from https://www.ncbi.nlm.nih.gov/pubmed/27160121
View at Publisher | View at Google Scholar - Xu, M., Zheng, X. M., Jiang, F., & Qiu, W. Q. (2018). MicroRNA-190b regulates lipid metabolism and insulin sensitivity by targeting IGF-1 and ADAMTS9 in non-alcoholic fatty liver disease. J Cell Biochem, 119(7), 5864-5874. doi:10.1002/jcb.26776
View at Publisher | View at Google Scholar - Xu, X., Ma, C., Duan, Z., Du, Y., & Liu, C. (2019). lncRNA ZEB1-AS1 Mediates Oxidative Low-Density Lipoprotein-Mediated Endothelial Cells Injury by Post-transcriptional Stabilization of NOD2. Front Pharmacol, 10, 397. doi:10.3389/fphar.2019.00397
View at Publisher | View at Google Scholar - Xu, Y., Xu, Y., Zhu, Y., Sun, H., Juguilon, C., Li, F., . . . Zhang, Y. (2020). Macrophage miR-34a Is a Key Regulator of Cholesterol Efflux and Atherosclerosis. Mol Ther, 28(1), 202-216. doi:10.1016/j.ymthe.2019.09.008
View at Publisher | View at Google Scholar - Xue, Y. L., Zhang, S. X., Zheng, C. F., Li, Y. F., Zhang, L. H., Su, Q. Y., . . . Li, X. W. (2020). Long non-coding RNA MEG3 inhibits M2 macrophage polarization by activating TRAF6 via microRNA-223 down-regulation in viral myocarditis. J Cell Mol Med, 24(21), 12341-12354. doi:10.1111/jcmm.15720
View at Publisher | View at Google Scholar - Yan, B., Yao, J., Liu, J. Y., Li, X. M., Wang, X. Q., Li, Y. J., . . . Jiang, Q. (2015). lncRNA-MIAT regulates microvascular dysfunction by functioning as a competing endogenous RNA. Circ Res, 116(7), 1143-1156. doi:10.1161/CIRCRESAHA.116.305510
View at Publisher | View at Google Scholar - Yan, M., Chen, K., Sun, R., Lin, K., Qian, X., Yuan, M., . . . Li, J. (2019). Glucose impairs angiogenesis and promotes ventricular remodelling following myocardial infarction via upregulation of microRNA-17. Exp Cell Res, 381(2), 191-200. doi:10.1016/j.yexcr.2019.04.039
View at Publisher | View at Google Scholar - Yang, C. L., Zheng, X. L., Ye, K., Sun, Y. N., Lu, Y. F., Ge, H., & Liu, H. (2019). Effects of microRNA-217 on proliferation, apoptosis, and autophagy of hepatocytes in rat models of CCL4-induced liver injury by targeting NAT2. J Cell Physiol, 234(4), 3410-3424. doi:10.1002/jcp.26748
View at Publisher | View at Google Scholar - Yang, X., Yao, B., Niu, Y., Chen, T., Mo, H., Wang, L., . . . Yao, D. (2019). Hypoxia-induced lncRNA EIF3J-AS1 accelerates hepatocellular carcinoma progression via targeting miR-122-5p/CTNND2 axis. Biochem Biophys Res Commun, 518(2), 239-245. doi:10.1016/j.bbrc.2019.08.039
View at Publisher | View at Google Scholar - Ye, D., Lou, G., Zhang, T., Dong, F., & Liu, Y. (2018). MiR-17 family-mediated regulation of Pknox1 influences hepatic steatosis and insulin signaling. J Cell Mol Med, 22(12), 6167-6175. doi:10.1111/jcmm.13902
View at Publisher | View at Google Scholar - Yi, R., Li, Y., Wang, F., Gu, J., Isaji, T., Li, J., . . . Zhao, Y. (2016). Transforming growth factor (TGF) beta1 acted through miR-130b to increase integrin alpha5 to promote migration of colorectal cancer cells. Tumour Biol, 37(8), 10763-10773. doi:10.1007/s13277-016-4965-6
View at Publisher | View at Google Scholar - Yin, H., Wang, Y., Wu, Y., Zhang, X., Zhang, X., Liu, J., . . . Zhang, R. (2020). EZH2-mediated Epigenetic Silencing of miR-29/miR-30 targets LOXL4 and contributes to Tumorigenesis, Metastasis, and Immune Microenvironment Remodeling in Breast Cancer. Theranostics, 10(19), 8494-8512. doi:10.7150/thno.44849
View at Publisher | View at Google Scholar - Yin, R., Zhu, X., Wang, J., Yang, S., Ma, A., Xiao, Q., . . . Pan, X. (2019). MicroRNA-155 promotes the ox-LDL-induced activation of NLRP3 inflammasomes via the ERK1/2 pathway in THP-1 macrophages and aggravates atherosclerosis in ApoE-/- mice. Ann Palliat Med, 8(5), 676-689. doi:10.21037/apm.2019.10.11
View at Publisher | View at Google Scholar - Ying, C., Sui-Xin, L., Kang-Ling, X., Wen-Liang, Z., Lei, D., Yuan, L., . . . Chen, Z. (2014). MicroRNA-492 reverses high glucose-induced insulin resistance in HUVEC cells through targeting resistin. Mol Cell Biochem, 391(1-2), 117-125. doi:10.1007/s11010-014-1993-7
View at Publisher | View at Google Scholar - Ying, W., Riopel, M., Bandyopadhyay, G., Dong, Y., Birmingham, A., Seo, J. B., . . . Olefsky, J. M. (2017). Adipose Tissue Macrophage-Derived Exosomal miRNAs Can Modulate In Vivo and In Vitro Insulin Sensitivity. Cell, 171(2), 372-384 e312. doi:10.1016/j.cell.2017.08.035
View at Publisher | View at Google Scholar - Yokomizo, T., Nakamura, M., & Shimizu, T. (2018). Leukotriene receptors as potential therapeutic targets. J Clin Invest, 128(7), 2691-2701. doi:10.1172/JCI97946
View at Publisher | View at Google Scholar - Yu, T., Gao, M., Yang, P., Liu, D., Wang, D., Song, F., . . . Liu, Y. (2019). Insulin promotes macrophage phenotype transition through PI3K/Akt and PPAR-gamma signaling during diabetic wound healing. J Cell Physiol, 234(4), 4217-4231. doi:10.1002/jcp.27185
View at Publisher | View at Google Scholar - Yuan, X., Li, Y., Wen, S., Xu, C., Wang, C., He, Y., & Zhou, L. (2022). CircLDLR acts as a sponge for miR-667-5p to regulate SIRT1 expression in non-alcoholic fatty liver disease. Lipids Health Dis, 21(1), 127. doi:10.1186/s12944-022-01740-9
View at Publisher | View at Google Scholar - Zhang, D., Qiu, X., Li, J., Zheng, S., Li, L., & Zhao, H. (2018). TGF-beta secreted by tumor-associated macrophages promotes proliferation and invasion of colorectal cancer via miR-34a-VEGF axis. Cell Cycle, 17(24), 2766-2778. doi:10.1080/15384101.2018.1556064
View at Publisher | View at Google Scholar - Zhang, L., Fu, Y., & Guo, H. (2019). c-Myc-Induced Long Non-Coding RNA Small Nucleolar RNA Host Gene 7 Regulates Glycolysis in Breast Cancer. J Breast Cancer, 22(4), 533-547. doi:10.4048/jbc.2019.22.e54
View at Publisher | View at Google Scholar - Zhang, M., Chi, X., Qu, N., & Wang, C. (2018). Long noncoding RNA lncARSR promotes hepatic lipogenesis via Akt/SREBP-1c pathway and contributes to the pathogenesis of nonalcoholic steatohepatitis. Biochem Biophys Res Commun, 499(1), 66-70. doi:10.1016/j.bbrc.2018.03.127
View at Publisher | View at Google Scholar - Zhang, M., Zhou, Z., Wang, J., & Li, S. (2016). MiR-130b promotes obesity associated adipose tissue inflammation and insulin resistance in diabetes mice through alleviating M2 macrophage polarization via repression of PPAR-gamma. Immunol Lett, 180, 1-8. doi:10.1016/j.imlet.2016.10.004
View at Publisher | View at Google Scholar - Zhang, N., Lei, J., Lei, H., Ruan, X., Liu, Q., Chen, Y., & Huang, W. (2015). MicroRNA-101 overexpression by IL-6 and TNF-alpha inhibits cholesterol efflux by suppressing ATP-binding cassette transporter A1 expression. Exp Cell Res, 336(1), 33-42. doi:10.1016/j.yexcr.2015.05.023
View at Publisher | View at Google Scholar - Zhang, Q., Mao, Z., & Sun, J. (2019). NF-kappaB inhibitor, BAY11-7082, suppresses M2 tumor-associated macrophage induced EMT potential via miR-30a/NF-kappaB/Snail signaling in bladder cancer cells. Gene, 710, 91-97. doi:10.1016/j.gene.2019.04.039
View at Publisher | View at Google Scholar - Zhang, X., Zhao, X., Fiskus, W., Lin, J., Lwin, T., Rao, R., . . . Tao, J. (2012). Coordinated silencing of MYC-mediated miR-29 by HDAC3 and EZH2 as a therapeutic target of histone modification in aggressive B-Cell lymphomas. Cancer Cell, 22(4), 506-523. doi:10.1016/j.ccr.2012.09.003
View at Publisher | View at Google Scholar - Zhang, Y., Le, X., Zheng, S., Zhang, K., He, J., Liu, M., . . . Wu, D. (2022). MicroRNA-146a-5p-modified human umbilical cord mesenchymal stem cells enhance protection against diabetic nephropathy in rats through facilitating M2 macrophage polarization. Stem Cell Res Ther, 13(1), 171. doi:10.1186/s13287-022-02855-7
View at Publisher | View at Google Scholar - Zhang, Y., Liu, X., Bai, X., Lin, Y., Li, Z., Fu, J., . . . Yang, B. (2018). Melatonin prevents endothelial cell pyroptosis via regulation of long noncoding RNA MEG3/miR-223/NLRP3 axis. J Pineal Res, 64(2). doi:10.1111/jpi.12449
View at Publisher | View at Google Scholar - Zhang, Y., Mei, H., Chang, X., Chen, F., Zhu, Y., & Han, X. (2016). Adipocyte-derived microvesicles from obese mice induce M1 macrophage phenotype through secreted miR-155. J Mol Cell Biol, 8(6), 505-517. doi:10.1093/jmcb/mjw040
View at Publisher | View at Google Scholar - Zhang, Y., Wang, F., Lan, Y., Zhou, D., Ren, X., Zhao, L., & Zhang, Q. (2015). Roles of microRNA-146a and microRNA-181b in regulating the secretion of tumor necrosis factor-alpha and interleukin-1beta in silicon dioxide-induced NR8383 rat macrophages. Mol Med Rep, 12(4), 5587-5593. doi:10.3892/mmr.2015.4083
View at Publisher | View at Google Scholar - Zhang, Z., Gao, W., Long, Q. Q., Zhang, J., Li, Y. F., Liu, D. C., . . . Wang, L. S. (2017). Increased plasma levels of lncRNA H19 and LIPCAR are associated with increased risk of coronary artery disease in a Chinese population. Sci Rep, 7(1), 7491. doi:10.1038/s41598-017-07611-z
View at Publisher | View at Google Scholar - Zhang, Z., Huang, X., Wang, E., Huang, Y., & Yang, R. (2020). Suppression of Mll1-Complex by Stat3/Cebpbeta-Induced miR-21a/21b/181b Maintains the Accumulation, Homeostasis, and Immunosuppressive Function of Polymorphonuclear Myeloid-Derived Suppressor Cells. J Immunol, 204(12), 3400-3415. doi:10.4049/jimmunol.2000230
View at Publisher | View at Google Scholar - Zhang, Z., Zhang, T., Feng, R., Huang, H., Xia, T., & Sun, C. (2019). circARF3 Alleviates Mitophagy-Mediated Inflammation by Targeting miR-103/TRAF3 in Mouse Adipose Tissue. Mol Ther Nucleic Acids, 14, 192-203. doi:10.1016/j.omtn.2018.11.014
View at Publisher | View at Google Scholar - Zhao, J., Li, H., Zhao, S., Wang, E., Zhu, J., Feng, D., . . . Liu, L. (2021). Epigenetic silencing of miR-144/451a cluster contributes to HCC progression via paracrine HGF/MIF-mediated TAM remodeling. Mol Cancer, 20(1), 46. doi:10.1186/s12943-021-01343-5
View at Publisher | View at Google Scholar - Zhao, Q., Wang, X., Hu, Q., Zhang, R., & Yin, Y. (2019). Suppression of TLR4 by miR-448 is involved in Diabetic development via regulating Macrophage polarization. J Pharm Pharmacol, 71(5), 806-815. doi:10.1111/jphp.13048
View at Publisher | View at Google Scholar - Zheng, J., Hu, L., Cheng, J., Xu, J., Zhong, Z., Yang, Y., & Yuan, Z. (2018). lncRNA PVT1 promotes the angiogenesis of vascular endothelial cell by targeting miR26b to activate CTGF/ANGPT2. Int J Mol Med, 42(1), 489-496. doi:10.3892/ijmm.2018.3595
View at Publisher | View at Google Scholar - Zhong, X., Ma, X., Zhang, L., Li, Y., Li, Y., & He, R. (2018). MIAT promotes proliferation and hinders apoptosis by modulating miR-181b/STAT3 axis in ox-LDL-induced atherosclerosis cell models. Biomed Pharmacother, 97, 1078-1085. doi:10.1016/j.biopha.2017.11.052
View at Publisher | View at Google Scholar - Zhong, Z., Umemura, A., Sanchez-Lopez, E., Liang, S., Shalapour, S., Wong, J., . . . Karin, M. (2016). NF-kappaB Restricts Inflammasome Activation via Elimination of Damaged Mitochondria. Cell, 164(5), 896-910. doi:10.1016/j.cell.2015.12.057
View at Publisher | View at Google Scholar - Zhou, D. M., Sun, L. L., Zhu, J., Chen, B., Li, X. Q., & Li, W. D. (2020). MiR-9 promotes angiogenesis of endothelial progenitor cell to facilitate thrombi recanalization via targeting TRPM7 through PI3K/Akt/autophagy pathway. J Cell Mol Med, 24(8), 4624-4632. doi:10.1111/jcmm.15124
View at Publisher | View at Google Scholar - Zhou, Y. X., Zhao, W., Mao, L. W., Wang, Y. L., Xia, L. Q., Cao, M., . . . Chen, J. (2018). Long non-coding RNA NIFK-AS1 inhibits M2 polarization of macrophages in endometrial cancer through targeting miR-146a. Int J Biochem Cell Biol, 104, 25-33. doi:10.1016/j.biocel.2018.08.017
View at Publisher | View at Google Scholar - Zhuge, B., & Li, G. (2017). MiR-150 deficiency ameliorated hepatosteatosis and insulin resistance in nonalcoholic fatty liver disease via targeting CASP8 and FADD-like apoptosis regulator. Biochem Biophys Res Commun, 494(3-4), 687-692. doi:10.1016/j.bbrc.2017.10.149
View at Publisher | View at Google Scholar
