

Research Article | DOI: https://doi.org/10.31579/2834-8788/011
Hyper-Exponential Growth of COVID-19 during Resurgence of the Disease in Russia Review Article
Department of Mathematics, The Assam Royal Global University Guwahati, Assam, India.
*Corresponding Author: Hemanta K. Baruah, Department of Mathematics, The Assam Royal Global University Guwahati, Assam, India.
Citation: Hemanta K. Baruah, (2023). Hyper-Exponential Growth of COVID-19 during Resurgence of the Disease in Russia, Journal of Heart and Vasculature, 2(3); DOI:10.31579/2834-8788/011
Copyright: © 2023, Hemanta K. Baruah. This is an open access article distributed under the Creative Commons Attribution License, which permits unrestricted use, distribution, and reproduction in any medium, provided the original work is properly cited.
Received: 03 May 2023 | Accepted: 19 May 2023 | Published: 29 May 2023
Keywords: pandemic; infectious disease; epidemiological modeling
Abstract
In Russia, COVID-19 has currently been growing hyper-exponentially. This type of a spread pattern was not seen during the first wave of the pandemic the world over. Indeed, when the disease had first appeared, in the accelerating stage the spread pattern was observed to have followed a highly nonlinear pattern that could be said to be approximately exponential or sub- exponential. As to why in the resurgence the growth has become hyper-exponential is another matter. But this has been happening in Europe and how long this would continue cannot be predicted. It may so happen that in the countries in which retardation has already been taking place, there may be resurgence of the disease. It was observed that in the World as a whole, retardation was on the threshold during the second half of September. But if the resurgence happens to follow the hyper-exponential growth pattern in different countries, there may be resurgence in the World as a whole.
Introduction
When COVID-19 had first appeared, it was observed that in the accelerating stage the disease had been spreading following a highly nonlinear pattern which was approximately exponential which might be termed as sub-exponential. In Europe, the spread of the disease almost came to a halt months ago. However, in Europe it has reappeared and this time unlike in the first wave the growth rate has been much faster than what was observed earlier. At the sub-exponential stage, forecasting about retardation was not difficult. In this article, we are going to show that the growth pattern in Russia is hyper-exponential, and it is not going to be easy to forecast when the growth would start retarding. Regarding hyper-exponential pattern we would now like to discuss a few things in short.
This is what was referred to hyper-exponential growth of a population. Fisher’s theorem was indeed the limit theorem of population dynamics which can be seen as a generalization of the Malthusian model. In Fisher’s model it is inherently presumed that the reason behind such a time dependent positive rate of growth is caused by genetic variations causing an additive effect with reference to time. Therefore, in Fisher’s model, the rate of change of the natural logarithm of is of first-degree in. Accordingly, the population growth in this model is much faster than the exponential growth model due to Malthus.
It may be noted that all biological populations grow according to exponential law, whereas the human population grows following the hyper-exponential law which essentially moves ahead of the exponential one. A hyper-exponential equation that allows describing dynamics of human population was in fact obtained in [3].
In this article, we are going to demonstrate that in Russia currently the rate of growth instead of decreasing with time is actually increasing. This would show that currently in Russia the growth is hyper-exponential.
The classical epidemiological models [4, 5, 6] assume exponential growth in the accelerating stage of the spread of an epidemic. Indeed, in the accelerating stage an exponential growth pattern should be only theoretically possible, for if the increase is actually exponential the epidemic would never come to a halt. Therefore, an epidemic growth can only be approximately exponential or sub-exponential with the rate of growth decreasing in time. This decreasing rate of growth would be reflected in the estimated values of the growth parameter with respect to time.
In this study, we shall use data from Worldometers.info [7]. We would like to mention here that the data in this source get edited after publication, which results in minor changes in the data. Therefore, there may be seen some minor changes in the data that we are going to tabulate in this article.
Methodology
We are going to demonstrate that the current growth rate of COVID-19 in Russia is following the hyper-exponential law. For that we would define but in the case of an epidemic, the function can be only approximately exponential. Once the cumulative total number of cases of the epidemic enters into the nearly exponential phase, ∆ starts to follow a reducing trend. It was observed in [8, 9, 10, 11, 12] that when the pandemic continues to grow nearly exponentially ∆ continues to decrease in time. In [13] it was shown that in six European countries in general and in Russia in particular, the values of ∆ were not showing decreasing trend. It was shown empirically that in Russia the situation was most serious. In this article, we shall now find the linear regression equation of ∆ on time. Based on the regression equation, after testing statistically we would infer whether the COVID-19 growth pattern in Russia is exponential or hyper-exponential.
Analysis
In what follows we are going to see first whether the values of ∆ are following a decreasing trend, or an increasing trend, or near constancy. As mentioned earlier, during the sub-exponential stage of growth of COVID-19, ∆ was observed to have followed a decreasing trend. It was shown in [11] that from June 23 to August 21, in India ∆ had followed the following three linear equations established using the method of least squares. The study was made for 60 days, separated into three equal parts of 20 days each. From June 23 to July 12, the equation was Statistical validity of all three equations was tested. It was statistically concluded that during the first 20 days the coefficient of regression of ∆ on was negative, during the next 20 days it was insignificant and in the last 20 days the regression coefficient was negative again. Using the equation fitted from data from August 2 to August 21, a forecast was made in [11] that starting from August 2, within no more than 78 days retardation would start in India. That forecast could be seen to be true.
In Table-1, we have tabulated the values of , and ∆ for Russia for the period of 20 days from 2 October to 21 October. In Fig.1 we have depicted the observed and the expected values of ∆
Date | Δz(t) | z(t) | ∆ |
1-Oct | 1185231 | 13.98545 | ---- |
2-Oct | 1194643 | 13.99336 | 0.00791 |
3-Oct | 1204502 | 14.00158 | 0.008219 |
4-Oct | 1215001 | 14.01026 | 0.008679 |
5-Oct | 1225889 | 14.01918 | 0.008921 |
6-Oct | 1237504 | 14.02861 | 0.00943 |
7-Oct | 1248619 | 14.03755 | 0.008942 |
8-Oct | 1260112 | 14.04671 | 0.009162 |
9-Oct | 1272238 | 14.05629 | 0.009577 |
10-Oct | 1285084 | 14.06633 | 0.010047 |
11-Oct | 1298718 | 14.07689 | 0.010554 |
12-Oct | 1312310 | 14.0873 | 0.010411 |
13-Oct | 1326178 | 14.09781 | 0.010512 |
14-Oct | 1340409 | 14.10849 | 0.010674 |
15-Oct | 1354163 | 14.11869 | 0.010209 |
16-Oct | 1369313 | 14.12982 | 0.011126 |
17-Oct | 1384235 | 14.14066 | 0.010838 |
18-Oct | 1399334 | 14.15151 | 0.010849 |
19-Oct | 1415316 | 14.16286 | 0.011356 |
20-Oct | 1431635 | 14.17433 | 0.011464 |
21-Oct | 1447335 | 14.18523 | 0.010907 |
Table-1: Values of ∆ in Russia from 2 October to 21 October
It is apparent that the values of ∆ are showing an increasing trend. We shall therefore move ahead to check whether this increasing trend is linear. The linear regression equation of ∆ forRussia for the period from 2 October to 21 October has been found to be ∆ 0.008201 + 0.000170338 t, 1, 2…
It is apparent that the linear regression coefficient of ∆ on t is positive, and this is evidence that the growth pattern of C0VID-19 in Russia during the period from 2 October to 21 October is perhaps hyper-exponential. We now proceed to see whether this equation is statistically acceptable or not. We have done the statistical tests of significance of the null hypothesis: ! 0 against the two-sided alternative hypothesis:" 0 where! is the population correlation coefficient between the variables ∆ and t. to concluding that the value of the regression coefficient (= + 0.000170338) is significantly different from 0.0. Indeed, we would like to mention at this point that the theoretical value of for 18 degrees of freedom at 1% probability level of significance is 2.87844, and at 0.1% probability level of significance it is 3.9651. This means that we can be 99.9% sure that the population correlation coefficient is very highly significantly different from zero.
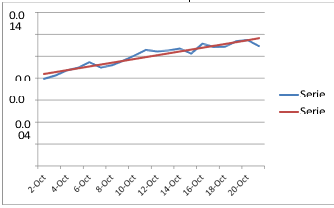
Figure. 1: Observed and Expected ∆ in Russia from 2 October to 21 October Series 1: Observed Values, Series 2: Expected values
| Date | Δz(t) | z(t) | N(t) |
| 22-Oct | 0.011778 | 14.19701 | 1464482 |
| 23-Oct | 0.011948 | 14.20896 | 1482085 |
| 24-Oct | 0.012119 | 14.22108 | 1500156 |
| 25-Oct | 0.012289 | 14.23337 | 1518705 |
| 26-Oct | 0.012459 | 14.24583 | 1537745 |
| 27-Oct | 0.01263 | 14.25846 | 1557290 |
| 28-Oct | 0.0128 | 14.27126 | 1577351 |
| 29-Oct | 0.01297 | 14.28423 | 1597943 |
| 30-Oct | 0.013141 | 14.29737 | 1619080 |
| 31-Oct | 0.013311 | 14.31068 | 1640775 |
| 1-Nov | 0.013481 | 14.32416 | 1663044 |
| 2-Nov | 0.013652 | 14.33781 | 1685904 |
| 3-Nov | 0.013822 | 14.35163 | 1709368 |
| 4-Nov | 0.013992 | 14.36563 | 1733454 |
| 5-Nov | 0.014163 | 14.37979 | 1758180 |
Table-2: Forecasts for Russia from 22 October to 5 November
In Table-2 we have shown the forecasts of the cumulative total number of cases for a short period from 22 October to 5 November. We have depicted the forecasts in Figure. 2.
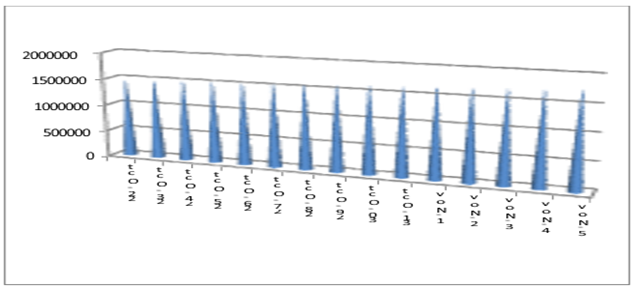
Fig. 2: Forecasts of the Cumulative Total Number of Cases in Russia from 22 October to 5 November
It is clear that in this second wave, the COVID-19 growth in Russia is hyper-exponential. When approximately would the situation change towards betterment is difficult to say. Thus, we have demonstrated that Fisher’s population dynamics model is at work in Russia with reference to spread of COVID-19. Hyper-exponential growth is very unusual in this case because when the disease had first appeared it was following the Malthusian model of population dynamics which states that the growth is exponential.
Conclusions
Whatever be the reason behind, the spread of COVID-19 in Russia is not following the pattern that it followed when it had first appeared in the World. During the accelerating stage, the growth was sub-exponential everywhere in the first wave, but in this second wave, the disease has started to grow much faster than that in the first wave. In the first wave, predictions could be made regarding around what time the retardation would start. But in the second wave the growth has been confirmed to be hyper-exponential. Therefore, it is now difficult to say when the retardation would restart.
References
- T. R. Malthus, 1798. An Essay on the Principle of Population. Johnson, London.
View at Publisher | View at Google Scholar - R. A. Fisher, 1930. The Genetical Theory of Natural Selection. Clarendon, Oxford.
View at Publisher | View at Google Scholar - S. D. Varfolomeyev, K. G. Gurevich, The Hyperexponential Growth of the Human Population on a Macrohistorical Scale. J Theor. Biol. 2001 Oct 7;212(3):367-372.
View at Publisher | View at Google Scholar - W. Kermak, A. McKendrick. (1927). A Contribution to the Mathematical Theory of Epidemics, Proceedings of the Royal Society A. Vol. 115 (1927): 700 – 721. (Republished as Contributions to the Mathematical Theory of Epidemics – I, Bulletin of the Mathematical Biology, (1991) 53 (1-2): 33-55.
View at Publisher | View at Google Scholar - W. Kermak, A. McKendrick. (1932) Contributions to the Mathematical Theory of Epidemics II. The Problem of Endemicity, Proceedings of the Royal Society A. Vol. 138: 55 – 83. (Republished in Bulletin of the Mathematical Biology, (1991) 53 (1-2): 57-87.
View at Publisher | View at Google Scholar - W. Kermak, A. McKendrick. Contributions to the Mathematical Theory of Epidemics III. Further Studies of the Problem of Endemicity, Proceedings of the Royal Society A. Vol. 141 (1933): 94 – 122. Bulletin of the Mathematical Biology, (1991) 53 (1-2): 89-118.
View at Publisher | View at Google Scholar - Worldometers.info. Total Corona Virus Cases in Russia, Publishing Date: October 24, 2020. Place of Publication: Dover, Delaware, U. S. A.
View at Publisher | View at Google Scholar - H. K. Baruah, A Simple Method of Finding an Approximate Pattern of the COVID-19 Spread, medRxiv preprint
View at Publisher | View at Google Scholar - H. K. Baruah, the current COVID-19 spread pattern in India, medRxiv preprint
View at Publisher | View at Google Scholar - H. K. Baruah, Nearly Perfect Forecasting of the Total COVID-19 Cases in India: A Numerical Approach, medRxiv
View at Publisher | View at Google Scholar - H. K. Baruah, The Uncertain COVID-19 Spread Pattern in India: A Statistical Analysis of the Current Situation, medRxivpreprint
View at Publisher | View at Google Scholar - H. K. Baruah, A Numerical Study of the Current COVID-19 Spread Patterns in India, the USA and the World, medRxiv preprint
View at Publisher | View at Google Scholar - H. K. Baruah, An Empirical Inference of the Severity of Resurgence of COVID-19 in Europe, medRxiv preprint
View at Publisher | View at Google Scholar
