

Research Article | DOI: https://doi.org/10.31579/2835-9232/046
Electronic Monitoring Versus Manual Paper-Based Monitoring for Hand Hygiene Compliance: A Comprehensive Health Economic Assessment Analysis
- Xiaolin Cheng 1*
- Yan Li 2*
- Nuo Chen 3*
- Wenbin He 1*
- Hanzhi Peng 4
- Xiaoyan Chen 1
- Fan Cheng 2
- Yibin Tan 2
- Lina Yu 5
- Wenwen Wu 3
- Ying Wang 2,6#
- Bilong Feng 1,6##
1Nursing Department of Zhongnan Hospital of Wuhan University, Hubei, China.
2Department of healthcare-associated Infection Prevention and Control, Zhongnan Hospital of Wuhan University, Hubei, China.
3School of Public Health and Management, Hubei University of Medicine, Shiyan, China.
4Dukekunshan University, Jiangsu, China.
5Department of Urology of Zhongnan Hospital of Wuhan University, Hubei, China.
6Hubei Engineering Center for Infectious Disease Prevention, Control and Treatment, Hubei, China.
*Corresponding Author: Ying Wang, Bilong Feng, Zhongnan Hospital of Wuhan University, Wuchang District Donghu Road 169, Wuhan Hubei 430071, China.
Citation: Xiaolin Cheng, Yan Li, Nuo Chen, Wenbin He, Hanzhi Peng, et al, (2024), Electronic Monitoring Versus Manual Paper-Based Monitoring for Hand Hygiene Compliance: A Comprehensive Health Economic Assessment Analysis, International Journal of Clinical Epidemiology, 3(2); DOI:10.31579/2835-9232/046
Copyright: © 2024, Ying Wang, Bilong Feng. This is an open-access article distributed under the terms of the Creative Commons Attribution License, which permits unrestricted use, distribution, and reproduction in any medium, provided the original author and source are credited.
Received: 07 December 2023 | Accepted: 12 January 2024 | Published: 15 April 2024
Keywords: hand hygiene; hand hygiene compliance; health economic evaluation
Abstract
Background: Monitoring hand hygiene compliance (HHC) of healthcare providers (HCPs) in healthcare facilities is critical for hand hygiene (HH) promotion. However, less is known about the cost and effectiveness of different HHC monitoring tools. In this study, we aimed to compare various health economic indicators corresponding to electronic system-based monitoring (ESM) and manual paper-based monitoring (MPM) for HHC to provide evidence-based advice for HHC monitoring measures targeted selecting.
Methods: A before and after self-controlled prospective study in 40 clinical departments with 4,524 HCPs was conducted from November 2022 to January 2023 (MPM implementation phase) and March 2023 to May 2023 (ESM implementation phase). The cost-effectiveness, cost-efficiency, the extent of the Hawthorne effect, and indirect cost–benefit of the two monitoring methods were compared.
Results: In high- and medium-risk clinical departments, the cost-effectiveness ratio of ESM (7,977.90 CNY and 13,794.60 CNY) was lower than that corresponding to MPM (9,039.61 CNY and 14,549.05 CNY). Compared with ESM, every 1% increase in the HHC of MPM resulted in a 39,881.62 CNY reduction in cost. Acceptability of ESM was higher when the cost was 40,000 CNY or less. The cost-efficiency ratio of MPM in all departments (155,775.56 CNY) was higher than that of ESM (36,796.76 CNY). The Hawthorne effect of MPM of HHC in all departments (43.99%) was more pronounced than that of ESM (35.69%), with a statistically significant difference between the two monitoring methods (p < 0.01). When ESM was used, the rate of healthcare-associated infections (1.39%) in all departments was higher than the case when MPM was used (1.34%), but no statistical difference was noted (p = 0.562).
Conclusions: For high-risk departments with multiple HH moments and more requirements for HHC monitoring frequency and coverage, ESM exhibited notable advantages over MPM in terms of cost-effectiveness, cost-efficiency, cost–benefit, and the Hawthorne effect.
Introduction
Healthcare-associated infections (HAIs) have become a globally recognized public health issue. The occurrence of HAIs, on the one hand, affects the recovery of patients, prolongs hospital stays, increases patients’ financial burden, and poses a threat to their physical health and life safety, and on the other, it leads to a higher incidence of medical disputes, reduces hospital bed turnover rates, and wastes a significant amount of healthcare resources [1]. Hand hygiene (HH) is the most basic, direct, affordable, and effective method for reducing HAIs [2]. The global hand hygiene compliance (HHC) rate among HCPs in healthcare facilities is reportedly suboptimal, ranging from 20% to 40%, which falls significantly short of the HH standards (90%–95%) for HCPs during medical activities established by the World Health Organization (WHO). The first global strategy for infection prevention and control (IPC) placed special emphasis on the requirement for continual surveillance of HH indicators to facilitate prompt feedback [3]. Additionally, it recommended that monitoring the HHC of HCPs in healthcare facilities is a crucial element of HH promotion programs [4]. The inconsistent distribution of regional healthcare resources globally has resulted in varying risks of HAIs among different disease groups within healthcare facilities. A critical issue when it comes to monitoring HH is selecting the most efficient monitoring tool for a particular situation, taking into account the available workforce, healthcare resources, acceptable HAI rates, and cost-effectiveness.
Currently, the most widely accepted approaches for HH monitoring around the globe are direct observation and indirect observation [5]. Direct observation, that is, “trained observers directly observing HHC” is still regarded as the “gold standard” for HHC monitoring and is the one of the most reliable measures of evaluating HHC [6-7]. This monitoring method is fairly straightforward and can be implemented regardless of the size or existing structure of the hospital. However, it is prone to the Hawthorne effect and is overly tedious and time-consuming, making it difficult to obtain accurate results. Also, this approach makes it challenging to conduct large-scale surveys [8]. Indirect monitoring includes but is not limited to estimating the consumption of paper towels, hand sanitizers, and soap, among other products, for maintaining HH or assessing the needs based on the nursing operation database. These methods require less time and resources compared with direct observation but have some biases, such as a lack of evaluation of patient factors and workload. In recent years, with the continuous development of technology, intelligent monitoring systems have been widely used in healthcare facilities and are considered potential alternative solutions for measuring and improving HHC. Previous studies documented the usage of electronic badges with alcohol vapor sensors to monitor whether HCPs practiced HH [9]. Some researchers have used smart rings worn on the fingers to monitor HHC. Compared with the most common manual paper-based direct observation method, using information systems for HHC monitoring has prominent advantages such as sustainability, reduced Hawthorne effect, saved human resources, improved data collection efficiency, and increased data traceability. Further investigations should be performed to evaluate the practicality, cost, acceptability, and cost-effectiveness of HHC monitoring information systems, even though they provide a novel way of accurately monitoring HHC.
This study was conducted to compare various health economic indicators of electronic system monitoring (ESM) and manual paper-based monitoring (MPM) for HHC and to utilize the results to furnish healthcare institutions with varying levels of resources and infection risk with HHC monitoring evidence-based advice.
methods
Study design
A before and after self-controlled prospective study in 40 clinical departments with 4,524 HCPs of Zhongnan Hospital of Wuhan University, China, was conducted from November 2022 to January 2023 (MPM implementation phase) and March 2023 to May 2023 (ESM implementation phase; Figure 1). MPM analysis relied on handwritten HHC records, with data being analyzed manually. ESM was accomplished using a self-developed app (patent number: 202230575169.5) embedded in nursing operation mobile including the following functions: HHC monitoring, automatic statistics, inquiry, analysis, reminders, and so on. This study has been approved by the Clinical Research Ethics Committee of Zhongnan Hospital of Wuhan University (approval number: 2023136K).
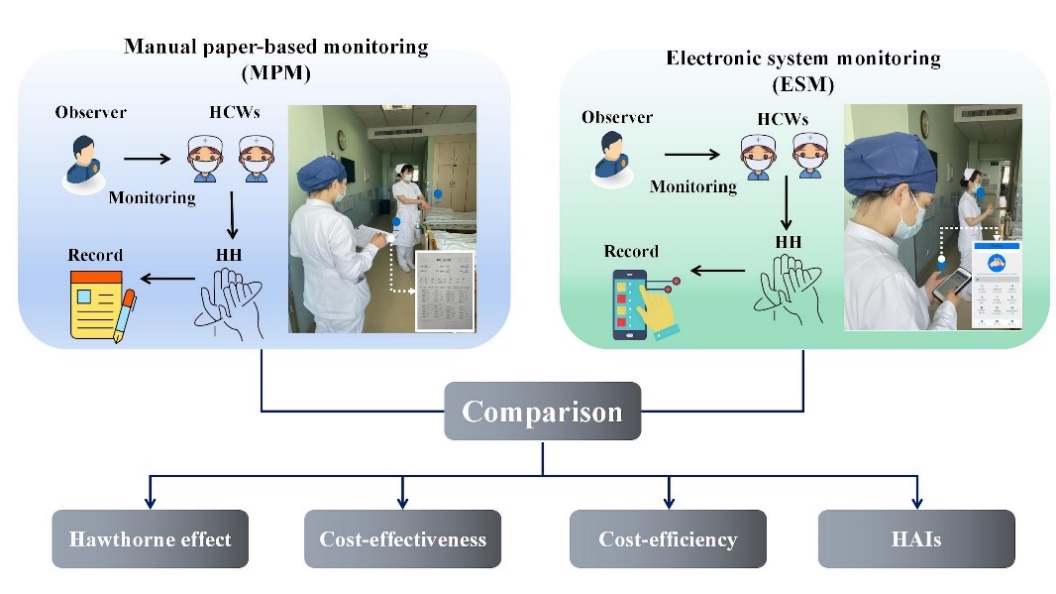
Figure 1: Flow chart comparing MPM and ESM.
The cost-effectiveness, cost-efficiency, Hawthorne effect, indirect cost–benefit analysis of the two monitoring methods were compared.
Basic data
Basic data included information concerning beds and HCPs of 40 clinical departments. In addition, these 40 clinical departments were divided into three levels of high risk (11 clinical departments), medium risk (23 clinical departments), and low risk (six clinical departments) according to the previous literature [11-13] (s table 1).
Categories | Departments |
High risk(n=11) | Respiratory and Critical Care Medicine(RCU; H1), Department of Trauma and Microscopic Orthopaedics(H2), Pediatric Intensive Care Unit(PICU; H3), Department of Infectious Diseases(H4), Department of Joint and Sports Medicine(H5), Department of Respiratory and critical Care General ward(H6), Neurology(H7), Neurosurgery(H8), Department of Esophageal Mediastinum and Lymphatic Radiochemotherapy(H9), Department of Radiotherapy and Chemotherapy for Head, Neck and Breast tumors(H10), Department of Hematological(H11) |
Medium risk(n=23) | Department of Obstetrics(M1), Department of Pediatrics(M2), Department of Otolaryngology, Head and Neck Surgery(M3), Department of Lung, Gastrointestinal Tumor Radiotherapy and Chemotherapy(M4), Department of Gynecology(M5), Department of Radiotherapy and Chemotherapy for Abdominal Tumors(M6), Hepatobiliary Research Institute(M7), Hepatobiliary and Pancreatic Surgery(M8), Department of Spine and Bone Qncology(M9), Department of Thyroid and Breast Surgery(M10), Center for Structural Heart Disease(M11), Department of Colorectal and Anal Surgery(M12), Interventional Diagnosis and Treatment Center and Tumor Interventional Treatment Center(M13), Urology(M14), Department of Endocrinology(M15), Department of Nephrology(M16), Digestive Endoscopy Center(M17), Gastroenterology(M18), Pediatric Surgery(M19), Department of Cardiovascular Medicine(M20), Department of Cardiovascular Surgery(M21), Neonatology Ward(M22), Thoracic Surgery Ward(M23) |
Low risk(n=6) | Orthopaedic Rehabilitation Ward(L1), Department of Traditional Chinese Medicine(L2), Dermatology(L3), Neurorehabilitation Ward(L4), Neuropsychological Ward(L5), General Department(L6) |
Table 1: Classification of departments
Costs
The cost of ESM included the cost of software, electricity, and labor cost. ① the cost of developing software (C1): the development cost of the software was 50,000 CNY(1 CNY equals about $0.14 [17]), the use cycle is at least ten years; our study lasted three months, and the average payment per department was 31.25 CNY; ② the cost of electricity (C2): a full charge required one degree of electricity, and according to the power supply standard of the hospital, the cost of a full charge of the device was 0.8 CNY [14], where the charging time of device was once a month; ③ labor cost (C3): According to the investigation and statistics of Wuhan Municipal Bureau of Human Resources and Social Security, the average monthly salary of employees in 2022 was 8,845 CNY [15], and the hourly labor cost was about 40 CNY. The APP for monitoring HHC used in this study was nested on the original electronic equipment of the hospital as an additional function. During the use of the device for ESM of HH, there was no phenomenon of equipment damage during the monitoring and after use. Therefore, the potential maintenance cost caused by equipment damage was not attributed to the monitoring of HHC in this study.
The cost of MPM included the cost of paper and the labor cost. ① cost of paper: the cost of an A4 paper was estimated to be 0.04 CNY. According to the design of WHO HHC questionnaire [16], it took two sheets of paper to conduct an MPM; ② labor cost (C3). The costs and calculation of the two monitoring methods are summarized in Table 1.
Monitoring method | Risk levels for different departments | No. of departments | Time consumed (hour) | No. of paper (piece) | Total cost (CNY) |
ESM | All departments | 40 | 411.14 | / | 17,702.92 |
High-risk departments | 11 | 113.07 | / | C1(31.25/department) ×11+C2(0.8/kilowatt hour) ×3(month)+C3(40/person/hour) ×113.07 | |
Medium-risk depart | 23 | 245.56 | / | C1(31.25/department) ×23+C2(0.8/kilowatt hour) ×3(month)+C3(40/person/hour) ×245.56 | |
| ments |
|
|
|
|
Low-risk departments | 6 | 52.51 | / | C1(31.25/department) ×6+C2(0.8/kilowatt hour) ×3(month)+C3(40/person/hour) ×52.51 | |
|
|
|
|
|
|
|
|
|
|
|
|
|
|
|
|
|
|
MPM | All departments | 40 | 545.50 | 169 | 21,826.68 |
High-risk departments | 11 | 178.00 | 53 | C4(0.04/piece) ×53+C3(40/person/hour) ×178.00 | |
Medium-risk departments | 23 | 296.66 | 93 | C4(0.04/piece) ×93+C3(40/person/hour) ×303.33 | |
Low-risk departments | 6 | 70.84 | 23 | C4(0.04/piece) ×23+C3(40/person/hour) ×70.84 |
Table 1: Cost calculation of two monitoring methods
HHC Monitoring Effectiveness
HHC includes hand wash and alcohol-based hand rub. HHC means that HPWs adhere to the established HH guidelines and the steps, time, and scope of HH are in line with regulations. HHC cost-effectiveness was quantified by monitoring HH action and opportunity by respective part-time IPCs from clinical departments and based on equation 1 [18]:
HHC monitoring effectiveness = (HH action)/ (HH opportunity) ×100% (equation 1)
HHC Monitoring Efficiency
Cost-efficiency was evaluated by time consumed on HHC monitoring and investigated by 10 full-time IPCs from departments of IPC and nursing. HHC was quantified through ESM by directly inputting the observed number of HH actions, and the system automatically generated the result of HHC and uploaded the same to the computer. The use of MPM required the observers to record the observed and actual HH moments in a paper observation sheet and calculate the results manually. HHC monitoring efficiency (equation 2) was estimated as the time spent for each monitoring moment:
HHC monitoring efficiency =

×100% (equation 2)
Hawthorne effect
The Hawthorne effect refers to a change in behavior as a motivational response to the interest, care, or attention received through observation and assessment [19]. The Hawthorne effect may deliberately increase HH when the observer perceives that he/she is being observed during HH monitoring. In this study, the HHC during the period when HCPs were not observed, i.e., the unobservation period of different risk departments was derived from previous references (sTable 2). The extent of the Hawthorne effect was calculated using equation 3 [20]:
Hawthorne effect =

×100% (equation 3)
Departments | HHC during no observation | Source |
Total | 44.90% | [21] |
High risk | 31.95% | [22] |
Medium risk | 49.01% | [23] |
Low risk | 35.00% | [24] |
Table 2: The HHC during no observation of different risk departments
Indirect benefit
Indirect benefit was evaluated in terms of disease burden due to HAIs during the monitoring period. HAI rates were estimated as the number of new infections in the total number of hospitalized patients in a certain period of time (equation 4):
HAI rates =
×100% (equation 4)
Data on HAI rates in this study were exported from the hospital information system of Zhongnan Hospital of Wuhan University. HAI rates without HH of different risk departments were estimated from references (sTable 3). The average disease burden per case of HAIs was 39,800 CNY estimated from references [25].
Departments | HAIs rates without HH | Source |
Total | 5.2% | [26] |
High risk | 9.54% | [27] |
Medium risk | 4.9% | [28] |
Low risk | 2.7% | [29] |
Table 3: The HAIs rates without HH of different risk departments
Outcomes
Cost-effectiveness ratio, cost-efficiency ratio, Hawthorne effect, and indirect cost–benefit ratio are the main outcomes and target effects and based on equations 5 to 9:
Cost-effectiveness ratio =

×100% (equation 5) ;
Cost-efficiency ratio =

×100% (equation 6) ;
Cost–benefit ratio (CBR) =

×100% (equation 7) ;

=

×100% (equation 8):
Incremental cost-effectiveness ratio=

×100% (equation 9).
Data and Analyses
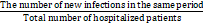
Cost calculation was recorded into Microsoft Excel by two research members, and the equation was set in Excel and calculated to avoid any computational errors. SPSS (version 16, SPSS Inc) software was used for statistical analysis, and the chi-square test was used to detect any statistical differences within and between groups. Based on the previous studies and combined with the data characteristics of this study, the decision tree model [10] was used to analyze cost-effectiveness. The decision node of the decision tree model was HHC monitoring, and the branches of the opportunity node were ESM and MPM. The nodes of these two branches are divided into HHC and its lack thereof, i.e., no-HHC. The decision tree model was performed using Tree Age Pro 2022 (Figure 2).
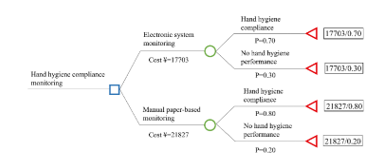
Figure 2: Decision tree model.
Results
Comparison of cost-effectiveness of the two monitoring methods among different departments
The total cost spent on ESM for the 40 departments (17,702.92 CNY) was 4,123.76 CNY lower than that of MPM (21,826.68 CNY). The HHC of MPM (80.16%) was higher than that of ESM (69.82%), and the difference was statistically significant (p < 0>
In high- and medium-risk departments, the cost-effectiveness ratio of ESM (7,977.90 CNY and 13,794.60 CNY, respectively) was lower than that of MPM (9,039.61 CNY and 14,549.05 CNY, respectively), indicating that the average cost of ESM was lower when improving HHC. On the contrary, in low-risk departments, the cost-effectiveness ratio of ESM (3,910.77 CNY) was higher than that of MPM (3,899.06 CNY), indicating that the average cost of ESM was higher. Compared with ESM, the incremental cost of MPM in all departments was 4,123.76 CNY, the incremental effectiveness was 10.34%, and the incremental cost-effectiveness ratio was 39,881.62 CNY. Every 1% increase in the HHC compliance of MPM was found to result in a 39,881.62 CNY reduction in cost. However, in low-risk departments, every 1% increase in the HHC of MPM was noted to result in a 3,828.29 CNY reduction in cost. As shown in Figure 3, both ESM and MPM are undominated strategies. Our tornado analysis revealed that the cost of MPM was the only factor that had the largest impact of the overall strategy (Figure 4).
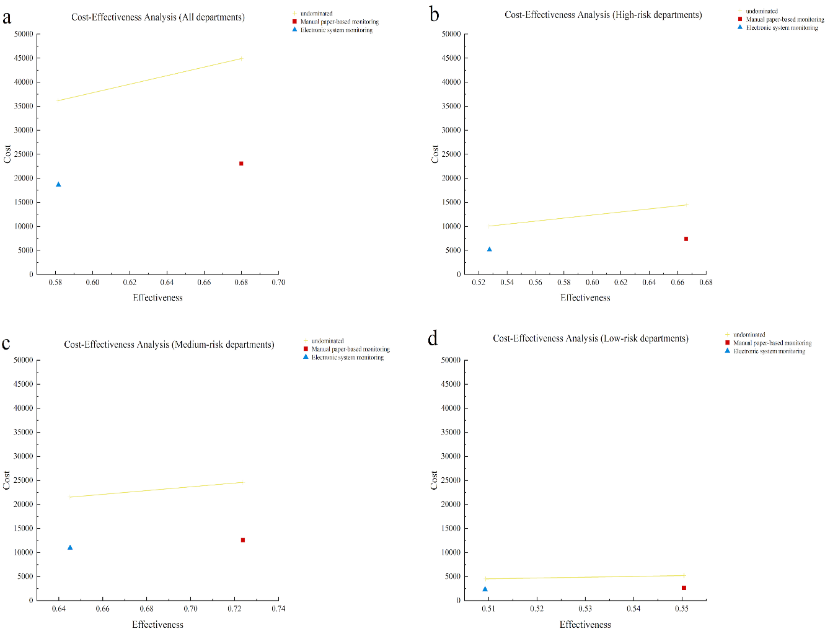
Figure 3: Cost-effectiveness analysis of using the two monitoring methods among the different risk departments Undominated (An undominated strategy indicates that when there are multiple strategies to choose from, the dominant strategy is better than the others).
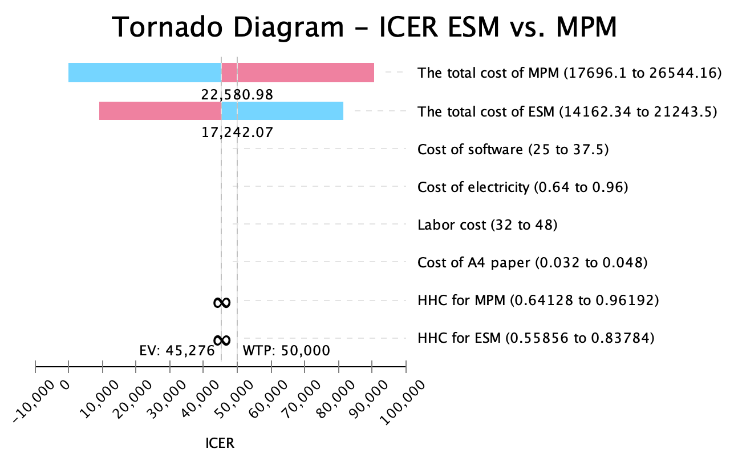
Figure 4: One-way sensitivity analysis on incremental cost.
Total | Cost (CNY) | Effectiveness (%) | P (Effectiveness) | P (Effectiveness) | Cost-effectiveness ratio (CNY) | Cost-effectiveness ratio-IQR (CNY) | Incremental cost (CNY) | Incremental effectiveness (%) | Incremental cost-effectiveness ratio (CNY) |
Total |
|
|
|
|
|
|
|
|
|
MPM | 21,826.68 | 3,807/4,749 (80.16%) | <0.05 |
| 27,228.89 | 599.77 (421.18, 903.77) | 4,123.76 | 10.34 | 39,881.62 |
ESM | 17,702.92 | 8,173/11,706 (69.82%) |
|
| 25,355.49 | 290.16 (290.16 ,762.19) |
|
|
|
High risk |
|
|
|
|
|
|
|
|
|
MPM | 7,122.12 | 832/1,056 (78) | <0.05 | >0.05 (vs MPM of medium risk) | 9,039.61 | 785.89 (489.94, 1,13) | 2,228.95 | 17.46 | 12,766.04 |
ESM | 4,893.17 | 2,400/3,913 (61.33%) |
| <0.05 (vs ESM of medium risk) | 7,977.90 | 395.97 (251.49, 840.38) |
|
|
|
Medium risk |
|
|
|
|
|
|
|
|
|
MPM | 12,137.05 | 2,521/3,022 () | <05 | <0.05 (vs MPM of low risk) | 14,549.05 | 521.90 (407.39, 8) | 1,540.31 | 6.60 | 23,338.03 |
ESM | 10,596.74 | 5,176/6,738 () |
| <0.05 (vs ESM of low risk) | 13,794.60 | 462.40 (245.74, 7) |
|
|
|
Low risk |
|
|
|
|
|
|
|
|
|
MPM | 2,567.51 | 376/571 (65%) | >0.5 | <0.05 (vs MPM of high risk) | 3,899.06 | 605.35 (481.04, 8) | -354.50 | 9.26 | -3,828.29 |
ESM | 2,213.01 | 597/1,055 (5.) |
| >0.05 (vs ESM of high risk) | 3,910.77 | 411.94 (350.59 6) |
|
|
|
Table 2: Cost-effectiveness analysis and incremental cost-effectiveness analysis of the two monitoring methods among the different risk departments.
The cost-effectiveness acceptability curve (CEAC, Figure 5) illustrates that when the cost of all departments, namely, high-risk departments, medium-risk departments, and low-risk departments was 40,000 CNY, 15,000 CNY to 20,000 CNY and 5,000 CNY to 10,000 CNY, respectively, the choice of ESM had a higher cost-effectiveness.
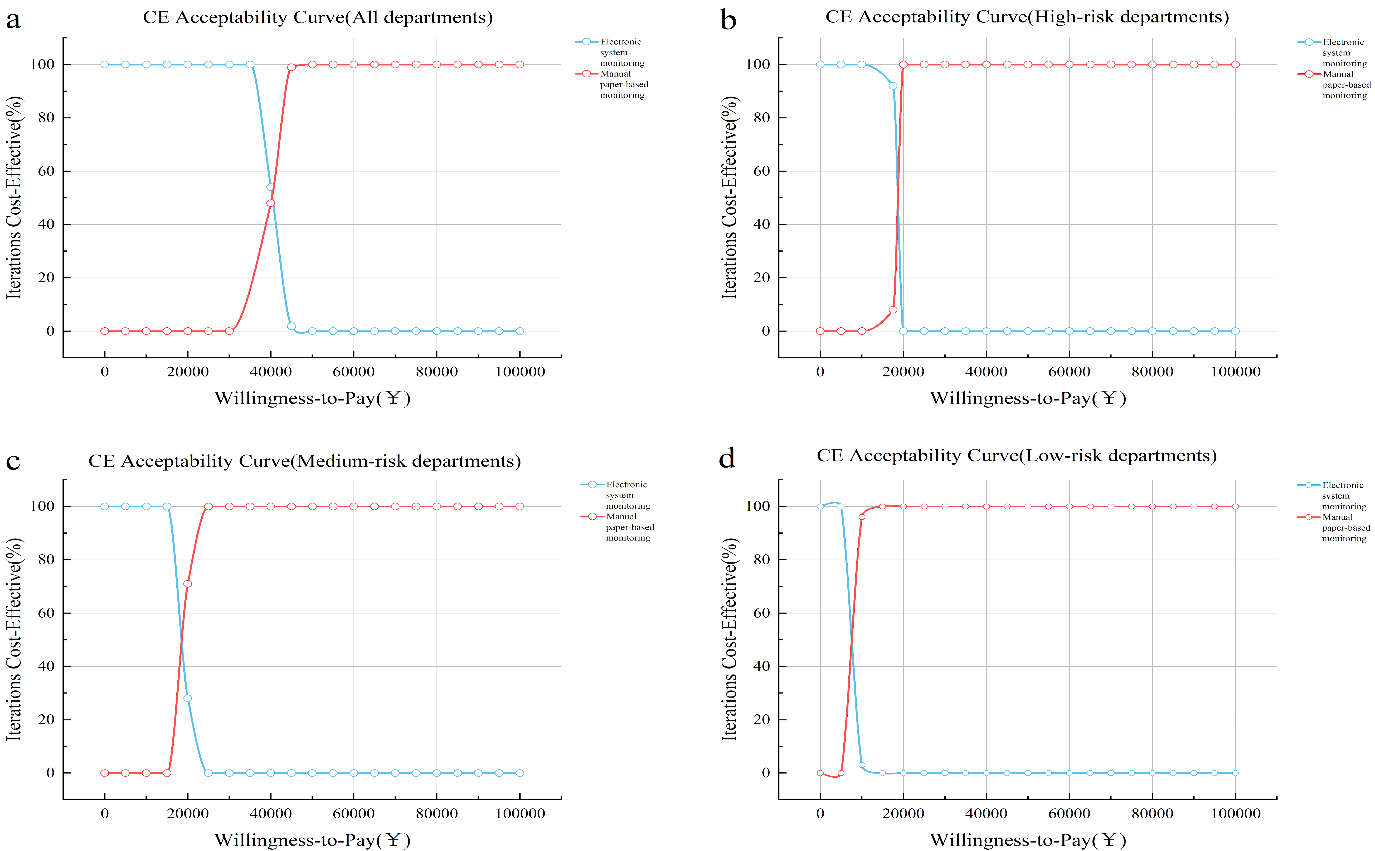
Figure 5: Cost-effectiveness acceptability curve of using the two monitoring methods among the different risk departments.
Comparison of cost-efficiency analysis of using two monitoring methods among different departments
Between the two monitoring methods, the efficiency of ESM (48.11%) in all departments was higher than that of MPM (14.20%), and the difference was statistically significant (p < 0>
departments (155,775.56 CNY) was higher than that of ESM (36,796.76 CNY), indicating that ESM was efficient and low-cost. In high-risk departments, the maximum gap in the cost-efficiency ratio of the MPM and ESM were 72,013.35 CNY and 8,858.02 CNY, respectively (Table 3).
Total | Cost (CNY) | Efficiency (%) | P (Effectiveness) | P (Effectiveness) | Cost-efficiency ratio (CNY) | Cost-efficiency ratio-IQR (CNY) |
Total |
|
|
|
|
|
|
MPM | 21,826.68 | 4,649/32,730 (14.20%) | <0.05 |
| 155,775.56 | 4,001.20 (3,967.57, 7,618.27) |
ESM | 17,702.92 | 11,706/24,331 (48.11%) |
|
| 36,796.76 | 426.95 (316.65, 864.62) |
High risk |
|
|
|
|
|
|
MPM | 7,122.12 | 1,056/10,680 () | <0.5 | <0.05 (vs MPM of Medium risk) | 72,013.35 | 6,741.71 (4,001.20, 8,002.40) |
ESM | 4,893.17 | 3,913/7,084 (55.24%) |
| <0.05 (vs ESM medium risk) | 8,858.02 | 373.00 (340.00, 718.31) |
Medium risk |
|
|
|
|
|
|
MPM | 12,137.05 | 3,022/18,200 (1) | <0.05 | <0.05 (vs MPM of low risk) | 73,144.76 | 4,001.20 (3,367.87,6,935.13) |
ESM | 10,596.74 | 6,738/14,223 () |
| <0.05 (vs ESM of low risk) | 22,370.15 | 469.00 (247.48, 893.11)
|
Low risk |
|
|
|
|
|
|
MPM | 2,567.51 | 571/3,850 (%) | <0.05 | <0.05 (vs MPM of high risk) | 17,312.95 | 4,001.20 (3,751.20, 4,173.37) |
ESM | 2,213.01 | 1,055/3,024 (3) |
| <0.05 (vs ESM of high risk) | 6,342.82 | 396.50 (314.20, 482.25) |
Table 3: Cost efficiency analysis of using two monitoring methods among the different risk departments.
Comparison of the extent of Hawthorne effect of using two monitoring methods among different departments
The extent of Hawthorne effect of MPM of HHC in all departments (43.99%) was higher than that of ESM (35.69%), and the difference between the two monitoring methods was noted to be statistically significant (p < 0>
of MPM (59.45%) and ESM (47.90%) in high-risk departments were all higher than those in other departments, and no statistical difference existed between the two monitoring methods in high-risk departments (p = 0.940). The extent of Hawthorne effect of MPM (41.46%) and ESM (36.20%) in medium-risk departments was the lowest, and there existed a statistical difference between the two monitoring methods (p < 0> Total HHC during observation (%) HHC during no observation (%) Hawthorne effect (%) P (Hawthorne effect) P (Hawthorne effect) Total MPM 3,807/4,749 (80.16%) 2,132/4,749 (44.90%) 43.99% <0.05 ESM 8,173/11,706 (69.82%) 5,256/11,706 (44.90%) 35.69% High risk MPM 832/1,056 (78.79%) 337/1,056 (31.95%) 59.45% >0.05 <0.05 (vs MPM of medium risk) ESM 2,400/3,913 (61.33%) 1,256/3,931 (31.95%) 47.90% <0.05 (vs ESM of medium risk) Medium risk MPM 2,521/3,022 (83.42%) 1,481/3,022 (49.01%) 41.46% <0.05 <0.05 (vs MPM of low risk) ESM 5,176/6,738 (76.82%) 3,302/6,738 (49.01%) 36.20% <0.05 (vs ESM of low risk) Low risk MPM 376/571 (65.85%) 200/571 (35.00%) 46.85% <0.05 >0.05 (vs MPM of high risk) ESM 597/1,055 (56.59%) 369/1,055 (35.00%) 38.15% <0.05 (vs ESM of high risk)
Table 4. Hawthorne effect analysis of using the two monitoring methods among different departments.
Comparison of cost-benefit analysis of the two monitoring methods among different departments
When ESM was used as the HHC monitoring approach, the HAI rates (1.39%) in all departments were higher than that when MPM was used (1.34%), but no statistical difference was observed (p = 0.562). When comparing the CBR of MPM and ESM, the average CBR of ESM in all departments (665.44 CNY) was lower than that of MPM (2,454.37 CNY),
indicating that in the current analysis, the CBR of ESM was better than MPM. Among departments with different risk levels, the CBR difference between the two monitoring methods in medium-risk departments was found to be the greatest. The average CBR of ESM (744.73 CNY) was 2,560.72 CNY lower than that corresponding to MPM (3,305.45 CNY; p < 0> Total Cost (CNY) HAI rates with hand hygiene (%) HAI rates without hand hygiene (%) P (HAI rates) P (HAI rates) Reduced disease burden (CNY) CBR (CNY) CBR-IQR (CNY) Total MPM 21,826.68 467/34,863 (1.34%) 1,813/34,863 (5.2%) <0.05 53,570,800 2,454.37 23,147.48 (6,893.53, 91,204.45) ESM 73,534.92 443/31,816 (1.39%) 1,654/31,816 (5.2%) 48,197,800 665.44 19,753.51 (8,580.36, 47,236.66) High risk MPM 7,122.12 232/7,864 () 747/7,864 (9) <0.05 <0.05 (vs MPM of medium risk) 20,497,00 2,87794 19,975.62 (9,944.58, 69,970.16) ESM 20,246.97 166/7,855 (2.11%) 749/7,855 (9.54%) <0.05 (vs ESM of medium risk) 23,203,400 1,146.02 12,854.52 (7,296.18, 30,604.40) Medium risk MPM 12,137.05 203/24,715 () 1,211/24,715 () <05 <0.05 (vs MPM of low risk) 40,118,0 3,3055 23,386.44 (5,262.27, 126,390.3) ESM 42,700.14 239/21,193 () 1,038/21,193 () >0.05 (vs ESM of low risk) 31,800,00 744.73 22,711.16 (12,525.18, 79,744.09) Low risk MPM 2,567.51 32/2,284 (1) 62/2,284 (%) >05 >0.05 (vs MPM of high risk) 1,194,00 465.04 36,705.09 (17,038.61, 71,270.98) ESM 10,587.81 38/2,768 (1) 75/2,768 (27) <0.05 (vs ESM of high risk) 1,472,60 139.08 31,127.70 (19,209.28, 43,404.11)
Table 5: Cost-benefit analysis of using the two monitoring methods among the different risk departments.
Discussion
The WHO Hand Hygiene Research Agenda for 2023–2030 underscores the need to advance HH research and increase the effectiveness of HHC monitoring through the use of information technology in the next two decades [30]. HHC monitoring is widely recognized as a highly challenging task that requires expertise and training, as this determines the accuracy of the monitoring results, and it also demands human resources and time investment, as this determines the completeness of the monitoring and the timeliness of feedback. This study marked the initial examination of a comprehensive health economic analysis to evaluate the utilization of ESM and MPM in HHC monitoring. The findings revealed that ESM outperformed MPM in terms of cost-effectiveness, cost-efficiency, cost–benefit, and the extent of Hawthorne effect.
In terms of cost-effectiveness, the total cost of ESM was lower than that of MPM. Particularly in high- and medium-risk departments, the average cost
of improving HHC using ESM was lower than that of MPM. In line with this study is the observation that most commonly used information technology systems for HHC motoring can significantly improve HHC among HCPs (OR = 3.06, p < 0>
the cost of installation [34]. Hence, MPM were recommended to be applied in low-risk medical departments.
As for cost-efficiency, ESM was noted to be superior to MPM, especially in high- and medium-risk departments, where their efficiency advantage was even more pronounced. We theorized that this could be attributed to the higher-risk divisions, such as the intensive care unit, executing more intrusive procedures, accommodating patients with weakened immune systems, and consuming a great number of resources in the hospital. The staff in this department were short-handed (with a nurse-to-patient ratio of 2.5 to 3:1 [35]), and there were shortages of equipment, drugs, and other resources, all of which put an extra strain on HHC, making it necessary to keep a close eye on personnel and time expenditure. ESM could help managers better understand the implementation, promptly identify problems and non-compliant behavior, and avoid waste and misuse of resources in high-risk departments. Moreover, through analysis of HH data, resource allocation could be optimized, and work efficiency can be improved [36]. This study’s analysis of cost-efficiency is consistent with the actual clinical demands. ESM could simultaneously monitor the HHC of multiple individuals online, and the data could be automatically analyzed, provided with feedback, and traced, thereby saving a significant amount of workforce and time costs. Kardaś-Słoma [9] also remarked that ESM can automatically collect data, improving the accuracy and timeliness of monitoring. The data collected through an ESM can be further analyzed and used for trend prediction. This analysis can help identify hotspots and high-risk periods for HH issues, enabling targeted preventive measures to improve HHC and correctness.
The Hawthorne effect, which refers to the alteration of behavior on being aware that one is being observed, was chosen as an evaluation indicator for monitoring biases. ESM, being discreetly conducted on nursing mobile devices, offers a certain level of secrecy when conducting compliance monitoring. On the other hand, MPM relies on paper records, making the Hawthorne effect more pronounced. Therefore, ESM was more effective in controlling the Hawthorne effect. Interestingly, it was found that HHC was lower under ESM compared with that under MPM, which may be attributed to a weaker Hawthorne effect associated with ESM. Casaroto’s research [36] in the ICU context demonstrated an HHC rate of 56.3% under MPM and 51.0% under ESM, with the Hawthorne effect being the influencing factor. Another research group [5] demonstrated a downward trend in HHC rates among HCPs after the introduction of intelligent monitoring systems. This phenomenon mainly occurs when direct observation and ESM are used simultaneously to measure HHC. Direct observation produces the Hawthorne effect, resulting in higher measurement results compared with those obtained through intelligent monitoring systems. These findings suggest that information technology-enabled monitoring provides a more accurate reflection of the actual situation, enabling the establishment of more precise baseline data for subsequent HHC interventions. Electronic HHC motoring systems can monitor HHC on all work shifts without a Hawthorne effect and provide significantly more data regarding HHC [4].
Finally, a comparison of the occurrence of HAIs during the application of the two monitoring methods was conducted. Although no significant difference was observed in the occurrence of HAIs between ESM and MPM during the study period, the cost-effectiveness of ESM outweighed that of MPM when considering the cost and the burden of patient diseases caused by HAIs. Likewise, Salinas-Escudero [37] observed that within one month of implementing ESM, the number of infections decreased by 46–79 individuals, resulting in cost savings of $308,927 to $546,795 for preventing HAIs.
However, it is important to note some limitations of this study. First, a large number of studies focused on using electronic monitoring systems to monitor HHC, including application-assisted direct observation, camera-assisted observation, sensor-assisted observation, and real-time locating system [4]. We cannot evaluate the health economics of all electronic monitoring systems. Hence, the findings cannot be extrapolated to other electronic monitoring systems. However, we intend to conduct an exploratory health economic evaluation in terms of tools for monitoring HHC and provide a reference for future research. Second, the cost of ESM did not consider the potential repair costs resulting from device damage in the later stages. Long-term prospective observational studies are also being conducted to provide a comprehensive health economic assessment of the long-term application of ESM in HHC.
Conclusion
In conclusion, for high-risk departments with multiple HH moments and higher requirements for HHC monitoring frequency and coverage, ESM exhibits notable advantages over MPM in terms of cost-effectiveness, cost-efficiency, cost–benefit, and the Hawthorne effect.
References
- Ray-Griffith SL, Wendel MP, Stowe ZN and Magann EF. (2018) Chronic pain during pregnancy: a review of the literature. Int J Womens Health; 10: 153-164.
View at Publisher | View at Google Scholar - Bearman G, Doll M, Cooper K and Stevens MP. (2019) Hospital Infection Prevention: How Much Can We Prevent and How Hard Should We Try? Curr Infect Dis Rep; 21: 2.
View at Publisher | View at Google Scholar - (2023). World Health Organization (WHO). Global report on infection prevention and control.
View at Publisher | View at Google Scholar - Wang C, Jiang W, Yang K, Yu D, Newn J, Sarsenbayeva Z, Goncalves J and Kostakos V. (2021) Electronic Monitoring Systems for Hand Hygiene: Systematic Review of Technology. J Med Internet Res; 23: 27880.
View at Publisher | View at Google Scholar - Boyce JM, Laughman JA, Ader MH, Wagner PT, Parker AE and Arbogast JW. (2019) Impact of an automated hand hygiene monitoring system and additional promotional activities on hand hygiene performance rates and healthcare-associated infections. Infect Control Hosp Epidemiol; 40: 741-747.
View at Publisher | View at Google Scholar - World Health Organization. (2009) WHO guidelines on hand hygiene in health care. Geneva: World Health Organization. 1-270.
View at Publisher | View at Google Scholar - Stewardson A, Sax H, Longet-Di Pietro S and Pittet D. (2011) Impact of observation and analysis methodology when reporting hand hygiene data. J Hosp Infect; 77: 358-9.
View at Publisher | View at Google Scholar - Boyce JM. (2017) Electronic monitoring in combination with direct observation as a means to significantly improve hand hygiene compliance. Am J Infect Control; 45: 528-535.
View at Publisher | View at Google Scholar - Kardaś-Słoma L, Lucet JC, Perozziello A, Pelat C, Birgand G, Ruppé E, Boëlle PY, Andremont A and Yazdanpanah Y. (2017) Universal or targeted approach to prevent the transmission of extended-spectrum beta-lactamase-producing Enterobacteriaceae in intensive care units: a cost-effectiveness analysis. BMJ Open; 7: 017402.
View at Publisher | View at Google Scholar - Alenzi EO. (2021) Cost-effectiveness analysis of polycystic ovary syndrome management and the risk of gestational diabetes in pregnant women: a decision-tree model. Expert Rev Pharmacoecon Outcomes Res; 21: 995-999.
View at Publisher | View at Google Scholar - Su X, Zong CX, Wang X, Sun XG, Lv FY and Sun L. (2022) Application of risk assessment system in classifed management of healthcare-associated infection in different departments. Chinese Journal of Infection Control; 21: 844-852.
View at Publisher | View at Google Scholar - Peng C and Jiang BZ. (2022) Risk assessment in the management of healthcare-associated infectionn in primary care hospitals. Modern Nurse; 21: 844-852.
View at Publisher | View at Google Scholar - Gan YJ, Lu YY and Liang DY. (2018) Risk assessment on healthcare-associated infection in different clinicadepartments based on rank-sum ratio method. Chinese Journal of Infection Control; 17: 418-422.
View at Publisher | View at Google Scholar - National Development and Reform Commission. Notice of the National Development and Reform Commission on Issuing the Guiding Opinions on the Trial Implementation of Ladder Tariffs for Residential Household Electricity.
View at Publisher | View at Google Scholar - (2022). Wuhan Municipal Bureau of Human Resources and Social Security. Wuhan Municipal Bureau of Human Resources and Social Security average monthly salary for employees in.
View at Publisher | View at Google Scholar - Specification of hand hygiene for healthcare workers WS/T 313-2019. (2020) Chinese Journal of Infection Control; 19: 93-98.
View at Publisher | View at Google Scholar - (2023). Exchange rate conversion.
View at Publisher | View at Google Scholar - Wang Y, Yang J, Qiao F, Feng B, Hu F, Xi ZA, Wu W, Ni ZL, Liu L and Yuan Y. (2022) Compared hand hygiene compliance among healthcare providers before and after the COVID-19 pandemic: A rapid review and meta-analysis. Am J Infect Control; 50: 563-571.
View at Publisher | View at Google Scholar - Sedgwick P and Greenwood N. (2015) Understanding the Hawthorne effect. BMJ; 351: h4672.
View at Publisher | View at Google Scholar - Hagel S, Reischke J, Kesselmeier M, Winning J, Gastmeier P, Brunkhorst FM, Scherag A and Pletz MW. (2015) Quantifying the Hawthorne Effect in Hand Hygiene Compliance Through Comparing Direct Observation with Automated Hand Hygiene Monitoring. Infect Control Hosp Epidemiol; 36: 957-62.
View at Publisher | View at Google Scholar - El-Saed A, Noushad S, Tannous E, Abdirizak F, Arabi Y, Al Azzam S, Albanyan E, Al Jahdalil H, Al Sudairy R and Balkhy HH. (2018) Quantifying the Hawthorne effect using overt and covert observation of hand hygiene at a tertiary care hospital in Saudi Arabia. Am J Infect Control; 46: 930-935.
View at Publisher | View at Google Scholar - Bruchez SA, Duarte GC, Sadowski RA, Custódio da Silva Filho A, Fahning WE, Belini Nishiyama SA, Bronharo Tognim MC and Cardoso CL. (2020) Assessing the Hawthorne effect on hand hygiene compliance in an intensive care unit. Infect Prev Pract; 2: 100049.
View at Publisher | View at Google Scholar - Kwok YLA, Juergens CP and McLaws ML. (2016) Automated hand hygiene auditing with and without an intervention. Am J Infect Control; 44: 1475-1480.
View at Publisher | View at Google Scholar - Yang XD, Huang YY, Huang Q and Hu Y. (2016) Study on the effect of hand hygiene behavior intervention on hand hygiene implementation rate of medical staff in rehabilitation department. Modern Nurse; 09: 132-134.
View at Publisher | View at Google Scholar - Lin Z, Zhu XQ, Chen ZN, Huang QQ, Jiang H, Zhang GQ, Huang GY and Meng LY. (2018) Evaluation of direct economic burden induced by nosocomial infection ofpatients with tumor-related diseases based on DRG. Infect Control Hosp Epidemiol; 39: 701-709.
View at Publisher | View at Google Scholar - Wang J, Liu F, Tartari E, Huang J, Harbarth S, Pittet D and Zingg W. T. (2018) The Prevalence of Healthcare-Associated Infections in Mainland China: A Systematic Review and Meta-analysis. Infect Control Hosp Epidemiol; 39: 701-709.
View at Publisher | View at Google Scholar - Qiu J, Wu L, Yang YJ, Luo J, Kang H and Zhang ZJ. (2022) Effect of sanitary wipes use on nosocomial infection rates in intensive care units. Chinese Journal of Infection Control; 39: 278-281.
View at Publisher | View at Google Scholar - Ding LL. (2008) A Nosocomial Infection Point-Prevalence Survey in Departments of InternaMedicine and Surgery:Results and Analysis. Chinese Journal of Infection Control; 9: 1268-1270.
View at Publisher | View at Google Scholar - Zhao XP, Cao LZ and Yao MH. (2014) Investigation and analysis of nosocomial infections of in-patients fromneurological rehabilitation department. Chinese Journal of Infection Control; 24: 4824-4832.
View at Publisher | View at Google Scholar - World Health Organization. WHO research for hand hygiene in health care 2023–2030: summary?
View at Publisher | View at Google Scholar - Lin TY, Lin CT, Chen KM and Hsu HF. (2021) Information technology on hand hygiene compliance among health care professionals: A systematic review and meta-analysis. J Nurs Manag; 29: 1857-1868.
View at Publisher | View at Google Scholar - Edmisten C, Hall C, Kernizan L, Korwek K, Preston A, Rhoades E, Shah S, Spight L, Stradi S, Wellman S and Zygadlo S. (2017) Implementing an electronic hand hygiene monitoring system: Lessons learned from community hospitals. Am J Infect Control; 45: 860-865.
View at Publisher | View at Google Scholar - Ward MA, Schweizer ML, Polgreen PM, Gupta K, Reisinger HS and Perencevich EN. (2014) Automated and electronically assisted hand hygiene monitoring systems: a systematic review. Am J Infect Control; 42: 472-8.
View at Publisher | View at Google Scholar - Boyce JM. (2017) Electronic monitoring in combination with direct observation as a means to significantly improve hand hygiene compliance. Am J Infect Control; 45: 528-535.
View at Publisher | View at Google Scholar - Møller-Sørensen H, Korshin A, Mogensen T and Høiby N. (2016) New technology markedly improves hand-hygiene performance among healthcare workers after restroom visits. J Hosp Infect; 92: 337-9.
View at Publisher | View at Google Scholar - Casaroto E, Generoso JR Jr, Serpa Neto A, Prado M, Gagliardi GM, de Menezes FG, Gonçalves P, Hohmann FB, Olivato GB, Gonçalves GP, Xavier N, Fernandes Miguel M, Edmond MB and Marra AR. (2022) Comparing human to electronic observers to monitor hand hygiene compliance in an intensive care unit. Antimicrob Steward Healthc Epidemiol; 2: 161.
View at Publisher | View at Google Scholar - Salinas-Escudero G, la Rosa-Zamboni D, Carrillo-Vega MF, Gamiño-Arroyo AE, Toledano-Toledano F, Ortega-Riosvelasco F, Granados-García V, Villa-Guillén M and Garduño-Espinosa J. (2023) Cost-effectiveness analysis of a hand hygiene monitoring system in a tertiary pediatric hospital in Mexico. Front Public Health; 11-1117680.
View at Publisher | View at Google Scholar
