

Research Article | DOI: https://doi.org/10.31579/2834-796X/052
Effect of Treadmill Testing using the Bruce Protocol on the P Wave in Normal Individuals
- S.R. Mittal *
- Govind Mittal
Professor and Head of the department of Cardiology, JLN Medical College, Ajmer, Rajasthan (India) Govind Mittal, MSc (Economics), Brahmpuri, Ajmer, Rajasthan (India).
*Corresponding Author: Professor and Head of the department of Cardiology, JLN Medical College, Ajmer, Rajasthan (India) Govind Mittal, MSc (Economics)
Citation: S.R. Mittal, Govind Mittal, (2024), Effect of Treadmill Testing using the Bruce Protocol on the P Wave in Normal Individuals, International Journal of Cardiovascular Medicine, 3(1); DOI:10.31579/2834-796X/052
Copyright: © 2024, S.R. Mittal. This is an open access article distributed under the Creative Commons Attribution License, which permits unrestricted use, distribution, and reproduction in any medium, provided the original work is properly cited.
Received: 28 December 2023 | Accepted: 15 January 2024 | Published: 22 January 2024
Keywords: bruce protocol; electrocardiography; exercise electrocardiography; pr segment; p wave; treadmill testing
Abstract
There was mild increase in the amplitude of the P wave with start of exercise or during the first stage of exercise. At this time, there was no change in the duration of the P wave. With increasing exercise, the p wave shifted towards the QRS complex. There was a progressive reduction in the amplitude and duration of the P wave. By the time of peak exercise, the P wave was usually completely merged in the rapidly sloping PR segment with the result that no separate P wave was visible. With the onset of recovery, as the heart rate declined, a P wave came out of the PR segment and a separate P wave was visible. Gradually the amplitude and duration of the P wave increased. By the end of the fifth minute or seventh minute of recovery, the amplitude and duration of the P wave resembled the pre-exercise P wave. In no case, there was any increase in the duration of the P wave throughout the test. Similarly, no case showed electrocardiographic evidence of left or right atrial abnormality.
Introduction
Einthoven published his observations about the effect of exercise on electrocardiograms is 1908 [1]. Since then large number of studies have been published on this topic. However, there are some areas of controversy regarding the effects of exercise on the P wave of the electrocardiogram in normal individuals. Most of the authors have observed an increase in the amplitude of the P wave in the vertical leads during dynamic exercise. Irisawa and Seyoma [2] felt that this increase in the amplitude of the P wave in the vertical leads was due to more synchronous activation of the two atria. They derived their conclusion from the remarkable shortening of the duration of the P wave after intravenous injection of epincphrine in dogs. They, however, accepted that tachycardia which develops as an effect of epincphrine was not identical to exercise-induced tachycardia. Simoons and Hugenholtz [3], however, found no shortening of the P wave at heart rates from 60 to 120 beats per minute. This observation is against the concept of more synchronous depolarization of the two atria.
Irisawa and Seyoma [2] evaluated ten healthy young male medical students, age range 20-22 years, by two-step test and concluded that the P wave amplitude promptly decreased after mild exercise. Simoons and Hugenholtz [3] evaluated fifty-six ‘apparently healthy’ men, aged 23 to 62 years by multistage bicycle ergometer. These workers observed that the amplitude of the P wave increased up to a heart rate of 170 beats per minute but there was a further marked increase in the first minute of recovery as opposed to a decrease in amplitude promptly after exercise observed by Iris Awa and Seyoma[2] Deckers[4] et al also observed that for corresponding heart rate, P wave amplitude was higher during recovery than during exercise.
Some authors have evaluated the effect of dynamic exercise on the duration of the P wave. Magnis et al [5,6] evaluated P wave duration in lead V5 at heart rates less than 140 beats per minute for diagnosis of myocardial ischemia. They observed that in the control group, P wave duration increased by less than 20 msec during the first minute of recovery in a standing position. They used four times magnified electrocardiogram for analysis. Lloyd – Thomas [7] evaluated sixty-seven 'healthy' individuals (age range 21 to 60 years) by Master's two-step test and recorded electrocardiograms in semi-recumbent position, 2,4 and 10 minutes after completion of exercise i.e., during recovery. He analysed P wave duration in leads II and III. An increase in P wave duration was obvious only in 37% of cases.
Baruteu et al [8] evaluated the effect of treadmill testing using the Bruce protocol on P wave duration in patients with isolated myocardial bridging of the left anterior descending coronary artery. They deserved that there was no change in the duration of the P wave up to one minute after exercise in the control group. On the other end, several workers have observed a shortening of P wave duration during exercise testing. [9-11]
Different workers have observed a maximum increase in the duration of the P wave at different times during recovery. Wsol et al [12] and Baruteu et al [8] observed a maximum increase in the first minute of recovery. Myrianthiefs et al [13] observed a maximum increase in the third minute of recovery.
Simoons and Hugenholtz [3] observed that exercise did not produce any change in the P wave vector. Deckers et al [4] observed that with exercise maximal P wave amplitude shifted anteriorly, leftwards and downwards. Lloyd Thomas [7] observed that, with exercise, the P wave axis shifted to the right. Ahmad and Blomquist [14] observed a significant increase in the posterior terminal P wave vector component in normal subjects. They, however, included persons with blood pressure of up to 150/90 mm Hg. This value is considered hypertension by the present definition.
Cause of the difference in observations is not clear. It could be related to the difference in the population studied, differences in the method of exercise and differences in the method of recording and analysis of the electrocardiogram. [2,3,4,7,14,15] Most of the workers evaluated persons who were considered normal by history, clinical examination and resting electrocardiogram. Different levels of blood pressure were considered ‘normal’. Simoons et al [3] used cut value of 160/90 mm Hg for defining normal blood pressure. Ahmad et al [14] used a cut value of 150/90 mm Hg. Both the values are considered 'hypertension' from presently accepted criteria. Irisawa and Seyama [2] evaluated young males aged 12 to 20 years. Simoons and Hugenholtz3 studied men aged 23 to 62 years. Deckers4 evaluated only women with a mean age of 39+10 years. None of the workers performed detailed echocardiographic evaluation to exclude subclinical abnormalities prior to exercise testing. Exercise-induced/aggravated left ventricular dysfunction is an important cause of abnormalities in P wave during exercise.
Initial workers used Master's two-step test as the mode of exercise. [2,7] Subsequently workers used bicycle ergometer [3,4] or treadmill. Irisawa and Seyoma [2] recorded only limb leads. Llyod Thomas [7] recorded limb leads along with CR1, CR4 and CR7 leads. Simoons and Hugenholtz [3] recorded modified Fronk leads. Ahmad and Blomquist [14] and Rautaharju et al [15] used Frank leads. Myrianthiefs et al [13] used a modified Mason-Likar lead system.
Myrianthiefs et al [13] used Ellestad’s protocol. Yigit et al [16] used modified Bruce protocol. Wsol et al [12] and Baruteu et al [8] used the Bruce protocol for exercise.
Irisawa and Seyoma [2] used computing technique and digital storage oscilloscope for recording and analysing electrocardiogram. Simoons and Hugenholtz [3] used analogue tap and digital computer systems. Ahmad and Blomquist [14] recorded electrocardiogram on magnetic tape. Deckers et al [4] used computer processing for analysis. Maganis et a [l6] and Myrianthiefs et al [13] magnified the electrocardiogram four times and five times respectively for analysis. Yigil et al [16] recorded electrocardiograms at 50 mm/sec speed and used ten-fold magnification for analysis.
Different workers have used different criteria for zero reference level to evaluate the amplitude of the P wave. Simoons and Hugenholtz [3] used a point 10 to 20 msec before the onset of QRS. Ahmad and Blomquist [14] used base line connecting the point of the beginning and end of the P wave. Routahariju et al [15] and Myrianthiefs et al [13] have used the level of PR segment at the onset of QRS.
Because of so many differences in material, methods and analysis, no clinically useful conclusion can be drawn. We, therefore tried to evaluate changes in the P wave during treadmill testing after carefully excluding the limitations of previous studies.
Material and methods
All individuals reporting for treadmill test over the last five years were analysed.
(2.1) Inclusion criteria
(a) No history of cardiac or respiratory symptoms.
(b) No history of treatment for hypertension, diabetes or ischemia heart disease.
(c) No history of coronary angioplasty or coronary artery bypass surgery.
(d) Absolutely normal resting twelve-lead electrocardiogram with special reference to the P wave morphology in all leads.
(e) No history of smoking.
(f) No family history of premature coronary artery disease.
(g) Body mass index between 18.5 to 24.9. Overweight and obesity perse are associated with left ventricular diastolic dysfunction, left atrial enlargement and increased left atrial pressure [17], that can affect the P wave morphology. Overweight and obese individuals have exaggerated increases in systolic blood pressure during physical exertion [18] and are, therefore, likely to have left ventricular diastolic dysfunction that can affect P wave morphology during exercise.
(h) Resting supine blood pressure 120/80 mm Hg or less. This value was chosen because individuals with higher blood pressure readings (prehypertension) have a higher incidence of subclinical cardiovascular disease. [19,20,21] Patients with systolic blood pressure of about 120 or diastolic blood pressure above 80 mm were also not included to keep the study population 'strictly normal.’
(i) Normal fasting blood sugar. Diabetes is associated with left ventricular diastolic dysfunction [22] which can affect left atrial pressure and P wave morphology during exercise.
(j) Normal fasting lipid profile.
(k) No abnormality on detailed echocardiographic evaluation.
(l) No history, clinical or radiological evidence of chronic obstructive airway disease or emphysema.
(m) Age less than 60 years. Left ventricular compliance decreases after the age of 50 years [23] and by the age of 65 years atrial contribution to left ventricu filling becomes equal to early filling. [24] This increases left atrial pressure and size [25] which increases further during exercise and can deform P wave morphology. Right heart catheterization study has shown an increase of up to 22 mm Hg in the pulmonary capillary wedge pressure during exercise in clinically healthy old induced.[26]
(2.2) Treadmill test protocol
Mason-Likar lead system [27] was used. All leads were correctly placed by a qualified and experienced technician. The whole procedure was supervised by a cardiologist. All twelve leads were recorded in the supine position and during active hyperventilation before exercise. Bruce protocol [28] was followed. All twelve leads were displayed on the monitor simultaneously and continuously. Exhaustion rather than age-predicted target heart rate was taken as the endpoint. [29] Exercise was also terminated if there was the development of angina, appearance of any arrhythmia, intraventricular conduction defect, ST-segment elevation of more than 1mm in any lead or significant ST-segment depression. There was no cool-down walk to avoid recovery of any electrocardiographic change. The patient was placed in a supine position soon after completion of the exercise. Recovery was recorded for nine minutes to detect any delayed 'only in recovery' changes. The final report included a print of raw electrocardiograms recorded at the end of each stage and averaged beats of all the twelve leads of each stage. Recording was done at the conventional speed of 25 mm/sec and 10 mm/mV.
(2.3) Exclusion criteria
(a) Any ectopic atrial rhythm appearing on standing or during active hyperventilation prior to exercise.
(b) Inability of the patient to perform adequate exercise.
(c) Development of chest pain, ST-segment elevation or ST-segment depression suggestive of myocardial ischemia during exercise or recovery.
(d) Appearance of ectopic atrial rhythm or any supraventricular tachyarrhythmia during exercise or recovery.
(e) Development of frequent ventricular ectopics, ill sustained ventricular tachycardia, sustained ventricular tachycardia, any intraventricular conduction defect or preexcitation during exercise or recovery.
(f) Increase in systolic blood pressure to 200 mm Hg or more during exercise. Such an increase in systolic blood pressure could cause transient impairment of left ventricular compliance and consequently affect P wave morphology. Such persons are also likely to develop hypertension during their day-to-day activities. The cumulative effect of such hypertensive response in likely to result in subclinical left ventricular diastolic dysfunction [30,31] that can affect P wave morphology during exercise.
(g) Excessive baseline shift or vibrations that prevented correct interpretation of the electrocardiogram.
Due to strict adherence to inclusion and exclusion criteria, only forty tests qualified for final analysis. There were28 males and 12 females.
(2.4) Analysis of changes in the P wave:
(a) P waves were analysed from the averaged beats recorded on standing, at the end of active hyperventilation at the start of exercise, at the end of each stage of exercise and at the end of the first, third, fifth, seventh and ninth minute of recovery. In case of any doubt, the respective raw electrocardiogram was also reviewed before making the final decision.
P wave were analyzed for any change in amplitude, duration and configuration.
Changes clearly obvious an visual examination without any magnification or computer assistance were considered to make the results useful for routine clinical setting.
Any doubtful change was considered as ‘no change’.
The point of beginning of the P wave was used as zero reference level for evaluation of the amplitude of the P wave because the end of the P wave was not distinct at a fast heart rate. With increasing heart rate, the end of the P wave merged imperceptibly with the rapidly sloping PR segment. Taking any point on the rapidly sloping PR segment or the beginning of the qRS complex result in an overestimation of the amplitude of the P wave [14].
Leads showing maximum change out of the following groups of leads were selected for reproduction in figures:
Leads I and aVL
Leads II, III and aVF
Lead aVR
Leads V1, V2
Leads V3, V4, V5, V6
Results
3.1 Demographic data
Parameter | Mean+SD |
Age (years) | 37.90+9.64 |
BMI | 21.63+2.93 |
Resting supine heart rate(bpm) | 72.33+11.34 |
Resting supine systolic blood pressure (mm Hg) | 115.95+4.54 |
Resting supine diastolic blood pressure (mm Hg) | 75.02+4.81 |
Table-1: Demographic data
Demographic data of patients are shown in Table 1.
Abbreviation - bpm- beats per minute.
3.2 Effect of exercise on P wave morphology
3.2.1 - Leads II,III, aVF, V3, V4, V5, V6
Similar changes were seen in all these leads. Changes were most prominent in leads II, V3 and/or V4.
(a) Effect of standing and/or active hyperventilation before
exercise:
In some cases, P wave amplitude increased (Fig.1). Changes were most obvious in individuals who had a significant increase in heart rate (Fig.1) over resting supine heart rate. In such cases, P wave duration decreased with an increased downward slope of the PR segment.
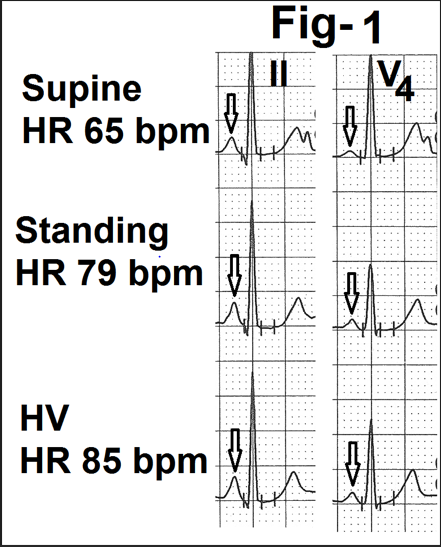
Figure 1- Showing leads II and V4 from the averaged beats in the supine position, standing and active hyperventilation (HV). There is an increase in the amplitude of the P wave on standing and a further increase during hyperventilation (marked as). There is a significant increase in heart rate (marked as HR) from 65 bpm on standing to 85 bpm during hyperventilation.
(b) Effect of exercise
In most of the cases, there was an increase in the amplitude of the P wave at the onset of exercise and during the first stage (Figure.2). There was no change in the duration of the P wave. In one case P wave became inverted in leads V5 and V6 at the start of the exercise. In this case, heart rate increased by 30 beats per minute from hyperventilation to the start of exercise. With increasing exercise, the P wave gradually shifted towards the QRS complex (reduction in the PR interval) with a progressive reduction in its amplitude and duration (Figure.2). Downslope of the P wave progressively merged into the beginning of the PR segment (marked as). There was a progressive increase in the rate of the downslope of the PR segment (Fig.2, marked as) which joined the beginning of the QRS complex. Changes were most prominent at peak exercise (Figure.2). At times, no separate P wave was visible at peak exercise. At time changes persisted during the first minute of recovery (Figure.2). Changes were clearly related to increasing heart rate. If there was no further increase or decrease at peak exercise, there were no sequential increase in change at peak exercise.
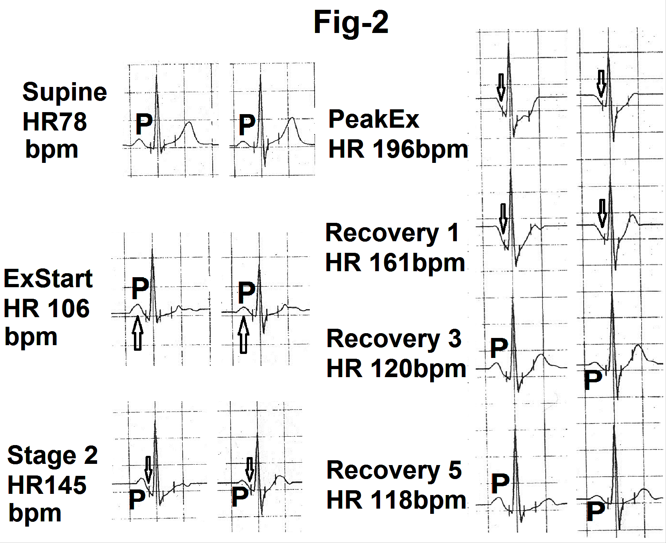
Figure 2- Showing lead II and V4 from the averaged beats in the supine position, start of exercise (Ex start), stage 2, peak exercise (peak Ex) and at the end of first minute, third minute and fifth minute of recovery (Recovery 1,3, and 5). There is increase in amplitude of the P was (marked as P) at the onset of exercise (marked as). With increasing exercise and heart rate P wave amplitude and duration is decreased. P wave is merged with the downsloping PR segment (marked as). P wave has gradually become normal during recovery.
(c) Effect of recovery
With the onset of recovery (end of first minute) the P wave started coming out of the PR segment (Fig.2b). By the end of the third and fifth minute of recovery, the P wave clearly separated from the PR segment (Fig.2b). By the end of the fifth minute of recovery, P wave amplitude and duration became identical to the P wave configuration before exercise. Rarely, the P wave took more than five minutes to normalize if the decrease in heart rate during recovery was slow.
3.2.2 Lead I
The amplitude of the P wave at rest was small in lead I. The sequence of changes were similar to leads II and V4. However, the magnitude of changes were less clearly appreciable (Fig.3). In one case P wave became negative at peak exercise (heart rate 186 beats per minute)
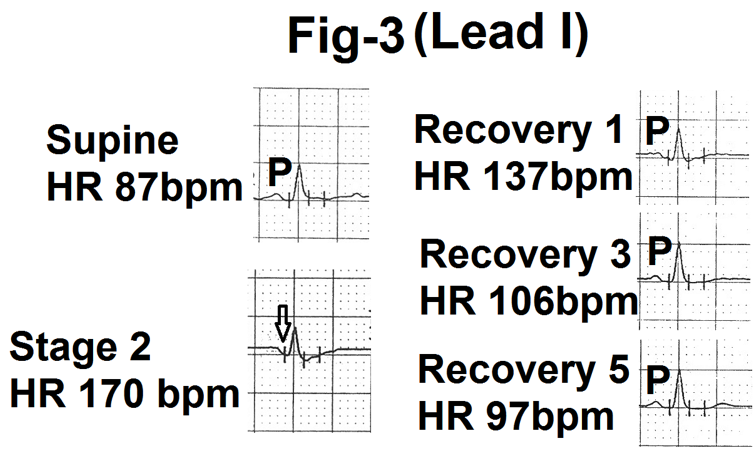
Figure 3- Showing lead I from the averaged beats in the supine position, stage 2, end of first minute, third minute and fifth minute of recovery (Recovery1,3 and 5). Stage two shows merging of P wave with dwonsloping PR segment (marked as). P wave is again clearly seen during recovery.
3.2.3 Lead aVL
P wave was of very low amplitude and at times even flat. It frequently became negative during exercise. With increasing heart rate P wave merged
in the sloping PR segment (Fig.4). Changes in duration were less clearly appreciable.
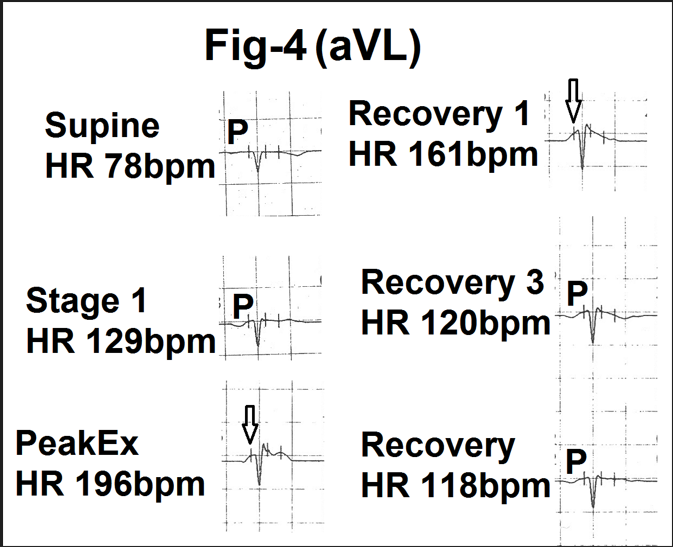
Figure 4-Showing lead aVL from the averaged beats in supine position. stage 1, peak exercise (Peak Ex), end of first minute, third minute and fifth minute of recovery (Recovery 1,3and 5). With increasing exercise and heart rate amplitude and duration of the P wave are progressively decreased. There is merging of the P wave (marked as P) in upsloping PR segment (marked as) during peak exercise and first minute of recovery. Clear P wave is again visible by the end of third and fifth minute of recovery.
3.2.4 Lead aVR
Changes were similar to leads II and V4 but were in the opposite direction as the P wave was negative in lead aVR. With exercise, the depth and
duration of the P wave gradually decreased and it merged into the upsloping PR segment (Figure.5). Changes gradually reversed towards normal during recovery.
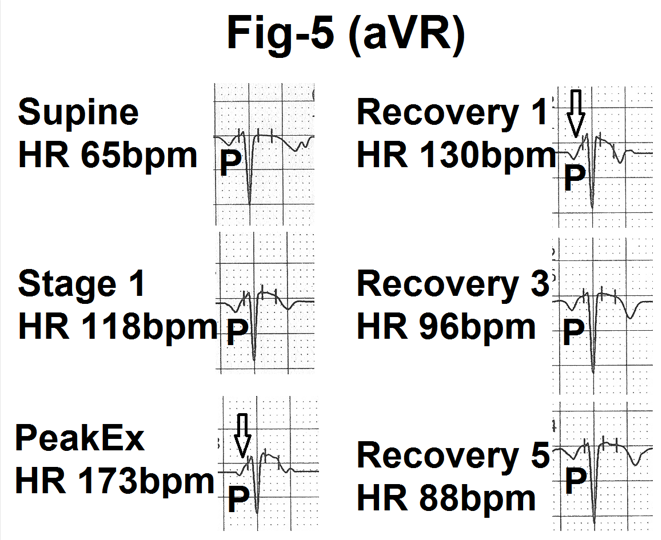
Figure 5- Showing lead aVR from the averaged beats in the supine position, stage 1, peak exercise (Peak Ex), end of first minute, third minute and fifth minute of recovery (Recovery 1, 3 and 5). P wave is negative. Therefore PR segment (marked as) is upsloping. With increasing exercise and heart rate amplitude and duration of the P wave is decreased. The P wave is progressively merged in the upsloping PR segment. During recovery, the P wave comes out of the PR segment and the P wave in normal by the end of the fifth minute of recovery.
3.2.5 Lead V1
At rest P wave was mildly positive or biphasic (+/-) with a small terminal negative deflection. There were no significant changes in most of the cases (Figure.6). In one case positive component increased on standing and during hyperventilation. Some cases showed a mild downward slope of the PR segment which joined the r wave or the QS complex. In some cases it gave
an impression of a depressed PR segment. The effect of PR segment became clear on simultaneous analysing lead V2 . In no case there was any increase in the amplitude of the initial positive component. Similarly, in no case, the terminal negative component increases abnormally to be called left atrial abnormality i.e. 0.04 mVsec.
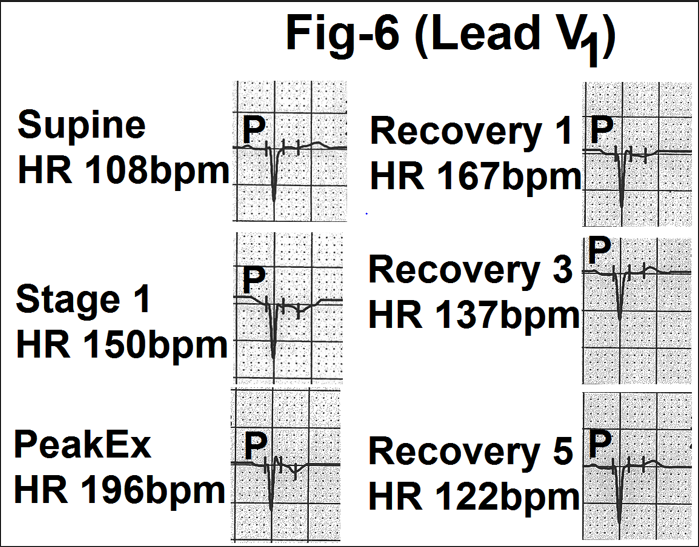
Figure 6- Showing lead V1 from the averaged beats in the supine position, stage 1, peak exercise (Peak Ex), end of first minute, third minute and fifth minute of recovery (Recovery 1, 3 and 5). With increasing heart rate, the amplitude and duration of the P wave in decreased. P wave is gradually merged into the sloping PR segment During recovery, the P wave gradually came out of the PR segment and became normal by the end of the fifth minute of recovery.
3.2.6 Lead V2
Changes were similar to leads V3 to V5 but were of less magnitude (Figure.7).
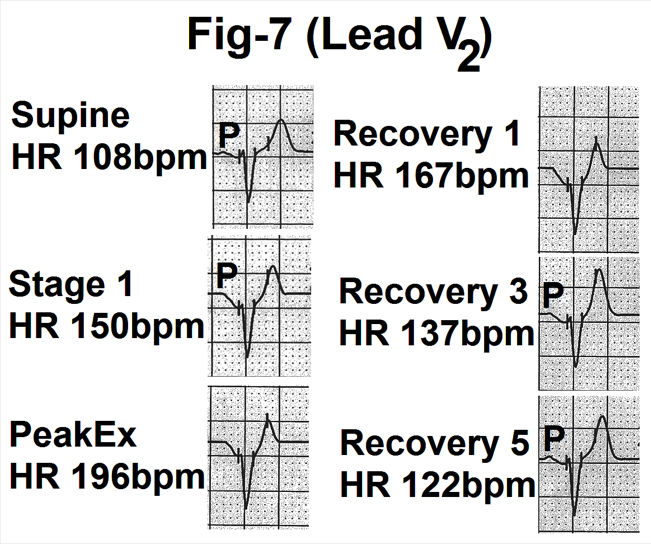
Figure 7- Showing lead V2 from the averaged beats in the supine position, stage 1, peak exercise (Peak Ex), end of first, third and fifth minute of recovery (Recovery 1, 3 and 5). With increasing heart rate, the amplitude and duration of the P wave is decreased. The P wave is gradually merged with the downsloping PR segment. During During recovery, the P wave has gradually come out of the PR segment and became normal by the end of the fifth minute of recovery.
3.3 Relation of onset of changes in P wave to stage of exercise, heart rate and increase in heart rate over resting supine heart rate
In most of the case (25) changes started by the end of the first stage of exercise of the Bruce protocol (Fig.8). Uncommonly changes started during active hyperventilation or on the start of exercise. In these cases, patients had
a significant increase in heart rate before exercise. In seven cases changes started in the second, third or fourth stage of exercise (Fig.8). Mean heart rate at the time of onset of changes in the P wave was 121.22+ 16.41 beats per minute (Table 2). The increase in heart rate over resting supine heart rate was 47.4+17.49 beats per minute (Table 2).
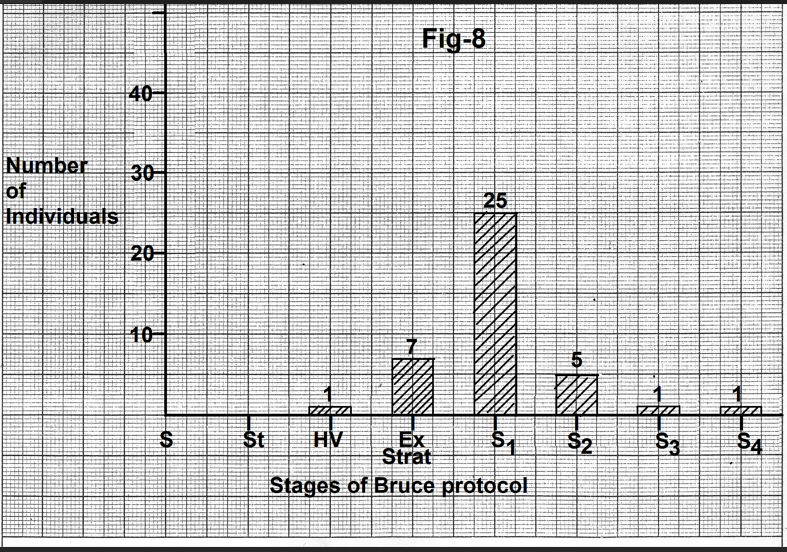
Figure 8- Bar diagram showing number of individuals showing the onset of change in the P wave with different stages of exercise. In most of the cases changes started by the end of the first stage of the Bruce protocol. Abbreviations- S-Supine, St- Standing, HV- Hyperventilation, Ex Start - Start of exercise, S1-Stage1, S2- Stage2, S3-Stage3, S4-Stage4.
3.4 Relation of maximal change in P wave to stage of exercise, heart rate and increase in heart rate over resting supine heart rate.
Maximal change was seen at peak exercise in all cases. The mean heart rate at the time of maximal change was 174.72+15.17 beats per minute (Table 2). The increase over resting supine heart rate was 105.43+17.79 beats per minute (Table 2).
3.5 Relation of onset of normalization of the P wave with the stage of recovery, heart rate and fall in heart rate from heart rate at peak exercise.
In thirty-six cases, the P wave started becoming normal by the end of the first minute of recovery (Fig.9). In four cases normalization of the P wave began by the end of the third minute of recovery. Mean heart rate at the onset of normalization was 125.33+21.27 beats per minute (Table 2). The mean decrease from the peak exercise heart rate was 48.42+17.08 beats per minute.
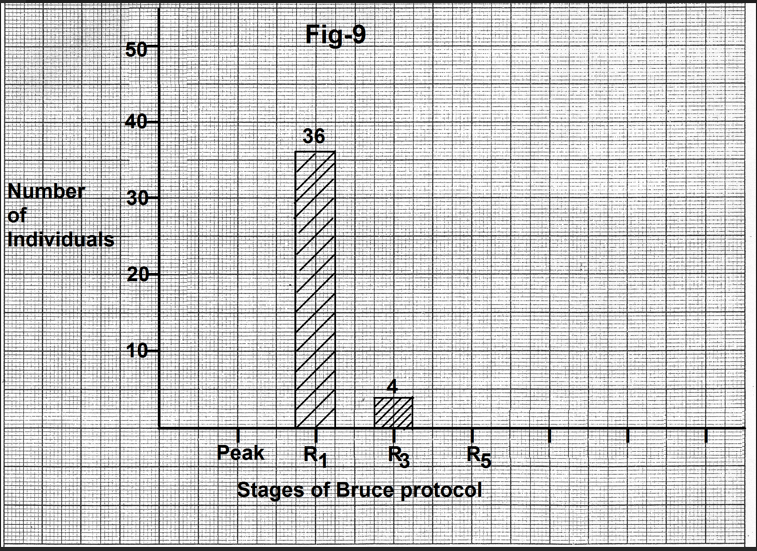
Figure 9- Bar diagram showing number of individuals showing onset of normalization of the P wave with different stages of recovery. In most of the cases P wave started becoming normal by the end of the first minute of recovery. Abbreviations- Peak-Peak exercise, R1- end of first minute of recovery, R3- end of third minute of recovery, R5- end of fifth minute of recovery.
3.6 Relation of complete normalization of the P wave to stage of recovery heart rate and fall in heart rate from peak exercise heart rate.
P wave morphology returned to resting/pre-exercise morphology by the end of the third minute of recovery in thirty cases. In the remaining four cases,
complete normalization occurred by the end of the fifth minute of recovery (Figure.10). Mean heart rate at the time of normalization of the P wave was 97.87+13.26 beats per minute (Table 2). Mean decrease in heart rate from the peak exercise heart rate was 73.6+11.85 beats per minute (Table 2).
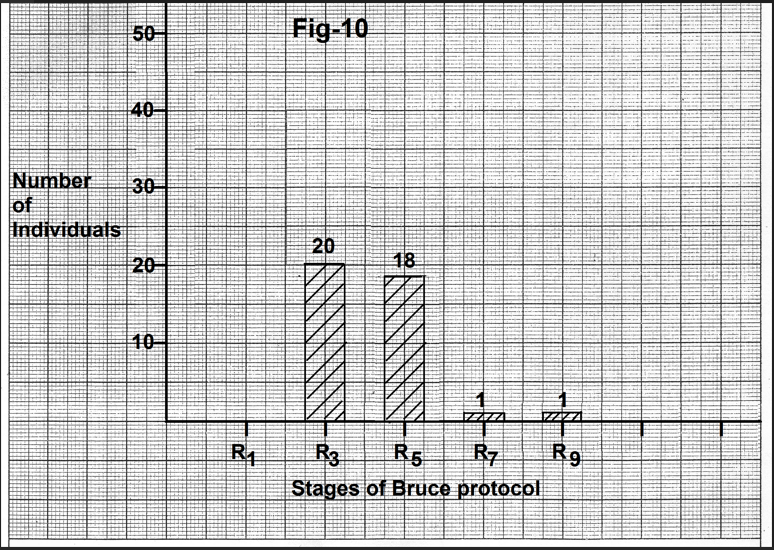
Figure 10-Bar diagram showing the relation of number of individuals showing complete normalization of the P wave to the stage of recovery. In most of the cases P wave became normal by the end of the third minute of recovery. Abbreviations- R1- end of the first minute of recovery, R3- end of third minute of recovery, R5- end of the fifth minute of recovery, R7- end of the seventh minute of recovery, R9- end of ninth minute of recovery.
Change in the P wave morphology | Heart rate (bpm) Mean+SD | Change in heart rate (bpm) Mean+SD |
Onset of change in morphology | 121.22+16.41 | Increase over-resting supine heart rate 47.4+17.49 |
Maximum change | 174.72+15.17 | Increase over-resting supine heart rate 105.43+17.79 |
Onset of reversal of morphology towards pre-exercise morphology | 125.33+21.27 | Decrease over peak exercise heart rate 48.42+17.08 |
Normalization of the P wave morphology | 97.87+13.26 | Decrease over-peak exercise heart rate 73.6+11.85 |
Abbreviation - bpm- beats per minute.
Table-2: Relation of changes in the P wave morphology with heart rate
Discussion
4.1 Effect of standing and/or hyperventilation
On standing, there is a gravity-mediated pooling of blood in the lower extremities and inferior mesenteric circulation. Decreased venous return causes a transient fall in blood pressure and a reflex increase in sympathetic activity. Normally the heart rate increases by about 10 to 15 beats per minute [32]. Differences in compensatory vasoconstriction result in inter-individual variability in the increase in heart rate on standing from supine position. Active hyperventilation after standing causes further increase in heart rate. The release of excitatory neurotransmitters from the brain is probably responsible. Lowered carbon dioxide concentration also causes splanchnic vasodilation via inhibition of vasomotor centre [33]. The resulting decrease in venous return results in decreased stroke volume and reflex increase in sympathetic activity. Inter-individual variation in rate and depth of respiration causes inter-individual variation in increase in heart rate.
Some individuals showed an increase in the amplitude of the P wave on standing from a supine position or during active hyperventilation after standing. These individuals had a definite sequential increase in heart rate (10 beats per minute or more) over the heart rate during the previous stage. An increase in sympathetic drive and/or downward shift of the diaphragm could be responsible for the increase in amplitude of the P wave.
4.2 Increase in the amplitude of the P wave without change in it’s duration at the beginning of the exercise.
We observed that in some individuals with initiation of exercise, P wave amplitude increased without any change in its duration in leads II, III, aVF and V4 to V6. Lloyd Thomas7 also deserved that an increase in amplitude was seen particularly in leads II and III.
Irisawa and Seyoma [2] have also observed augmentation of the P wave amplitude. They felt that it was due to more synchronous activation of the two atria. They derived their conclusion from observations of injection of epinephrine in animals. This explanation looks unlikely for severe reasons. Firstly, the effects of sympathetic stimulation during exercise are different from the effect of injection of epinephrine. Exercise has several additional hemodynamic effects. Secondly, synchronous depolarization of the two atria should result in the shortening (reduction in the duration) of the P wave. We observed that the initial increase in the amplitude of the P wave was not accompanied by any decrease in its duration. Other workers [3] have also observed that there is no shortening of the P wave at heart rates from 60 to 120 beats per minute. Some authors have observed an increase of less than 20 ms in the duration of the P wave at heart rates of less than 140 beats per minute. [5,6] These authors studied electrocardiograms that were magnified several times. Such small changes are difficult to appreciate visually on standard electrocardiograms. Thirdly, we observed that the amplitude and duration of the P wave decreased with increasing sympathetic drive the accompanies increasing workload and increasing heart rate. On the contrary, P wave amplitude and duration increased with decreasing sympathetic drive and heart rate during recovery. Previous studies have shown that these heart rates are usually attained during the start of exercise or the first stage of the Bruce protocol. [34] We feel that the increase in the amplitude of the P wave in inferior leads (II, III, aVF) and left lateral chest leads (V4, V5, V6) without any change in its duration is due to rightward and anterior shift of the mean P wave vector with initiation of exercise. This hypothesis is supported by our observation that in some cases initially positive P wave in leads I and aVL became negative during exercise i.e. shifted to the negative half of these leads. Deckers et al [4] have also observed that with exercise there is the gradual shift in the maximal P wave amplitude anteriorly, leftwards and downward. Lloyd Thomas [7] has explained that deviation of the P wave axis during exercise could be due to the depressed position of the diaphragm.
4.3 Effect of increasing exercise
We observed that with the increasing exercise above stage 1, P wave shifted towards the ensuing QRS complex. The amplitude and duration of the P wave clearly & visibly decreased progressively and the P wave gradually merged in the ensuing PR segment. Near peak exercise, the P wave completely merged into the PR segment and no separate P wave was visible. Other authors [9,10,11] have also observed that exercise causes a shortening of about 0.02 seconds in lead II in normal persons. Our observations are contradictory to the observations of Simoons and Hugenholtz [3]. They observed that there was a gradual increase in the amplitude of the P wave with increasing heart rate. However, their study has several limitations, Firstly, these authors studied ‘apparently’ normal individuals. Secondly, cardiovascular problems were excluded only by history. Thirdly, blood pressure up to 160/90 mm Hg was considered normal which is considered 'hypertension' from the present definition. Fourthly, the authors used a point 10 to 20 msec before the onset of the QRS complex as zero reference level for measuring the amplitude of the P wave. Our observations show that this point will fall on the rapidly downsloping PR segment and, therefore, give the false impression of an increase in the amplitude of the P wave (Fig.11). Fifthly, chest electrodes were placed at the level of the fifth intercostal space. This is unconventional. Sixthly, the authors used a computer system and analysed electrocardiograms at a rate of 500 mm/sec. Such an analysis is not clinically feasible.
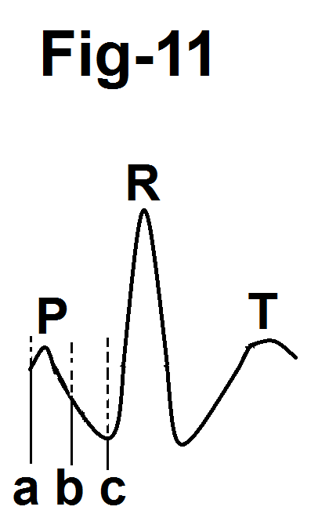
Figure 11-Diagram showing that taking zero reference point on the PR segment(b) or at the beginning of the QRS complex (c) results in an overestimation of the amplitude of the P wave.
Deckers et al [4] also observed an increase in P wave amplitude with exercise. However, their study also has several limitations. Firstly, these authors also excluded cardiovascular disease by history and resting electrocardiogram. Secondly, they included individuals with a blood pressure of up to 165/95 mm Hg. These values will be defined as 'hypertension' from the present criteria. [37] Thirdly, they did not exclude smokers and, therefore, their subjects are likely to have individuals having chronic obstructive airway disease and emphysema. Fourthly, these workers also used a point 12 to 20 ms before the onset of the QRS complex as a baseline for calculation of the amplitude of the P wave. This point also falls on the rapidly downsloping PR segment resulting in the false impression of increased amplitude of the P wave. Ahmad et al [14]have also stressed that taking the beginning of the QRS complex as the baseline results in an overestimation of the amplitude of the P wave.
We observed that the duration of the P wave decreases from stage 2 to peak exercise. P wave duration did not increase in any case.
With increasing exercise and heart rate, the PR segment became progressively sloping. This was because of the effect of the atrial repolarization wave (Ta wave). Normally the Ta wave is small and hidden in the QRS complex.35 With increasing heart rate during exercise the Ta wave amplitude as well as duration progressively increases. [10,11] Therefore, the Ta wave encroaches on the PR segment before the QRS complex and on the ST segment after the QRS complex. The direction of the Ta wave is opposite to that of the P wave. [35,36] Therefore in most of the leads with positive P wave, the Ta wave is negative. In these leads the PR segment becomes downsloping. In leads with a negative P wave (lead aVR and at times lead aVL), the PR segment becomes upsloping. In lead V1, the PR segment becomes downsloping. The slope of the PR segment increased progressively with increasing heart rate. Downward displacement of the Pq segment from the isoelectric line due to the effect of the Ta wave has also been observed by other workers. [5,11,14]
None of our cases showed any evidence of right and/or left atrial abnormality during exercise. Yokoyama et al38 also did not observe any evidence of left atrial abnormality in leads V3R and V1 in normal persons after a Master’s test. Hemodynamic studies have also shown that there is no significant change in right atrial pressure during upright exercise in normal persons. [39]
4.4 Changes in the P wave during recovery
We observed that with the onset of recovery, P wave started coming out of the rapidly sloping PR segment. By the end of the third minute of recovery, separate P was clearly visible. By the end of the fifth minute of recovery, the P wave morphology resembled the preexercise P wave in amplitude and duration and the PR interval became isoelectric. Uncommonly the P wave and the PR segment changes normalised by the end of the seventh minute of recovery. These changes are due to the progressive normalization of the Ta wave. Indirectly, it means that the P wave amplitude increases during recovery as compared to the amplitude at peak exercise. However, it is important to realize that the amplitude does not increase as compared to the preexercise amplitude. Other workers who have analysed electrocardiograms recorded only after exercise have made similar conclusions [7].
We observed that there was no visually appreciable increase in the duration of the P wave over preexercise level in any case. Myrianthefs et al [13] observed that there was an increase of around 4 msec by the end of the third minute of recovery over the preexercise value in their control group. They, however, analysed electrocardiograms using 5 times magnification. Such minimal changes can not be appreciated visually. Wsol et al [12] observed that their control group had an increase of about less than 6 msec in the duration the P wave during the first minute of recovery over preexercise P wave duration. They analysed four fold magnification of the electrocardiogram. Such a minimal change can not be appreciated visually. Further, their control group included a significant number of individuals with arterial hypertension, left ventricular hypertrophy, overweight and age above sixty years. Difference in various demographic and clinical characterstics from the coronary stenosis group was also not significant. Therefore, their control group can not be considered truly ‘normal’.
Conclusions
In strictly ‘normal’ individuals (as detailed in material and methods section).
- Some individuals can show mild increase in the P wave amplitude on standing from the supine position or during active hyperventilation prior to exercise if they have a significant increase in heart rate.
- Some individuals show a mild increase in the P wave amplitude without any visually detectable change in P wave duration at the start of exercise or during the first stage of exercise.
- With increasing exercise and heart rate, P wave shifts towards the QRS complex with a progressive reduction in amplitude and duration. The descending limb of the P wave progressively merges with the rapidly sloping PR segment. Changes are maximal at peak exercise when a separate P wave may not be visible.
- During recovery, the P wave comes out of the PR segment. Separate P wave is clearly visible by the end of the third minute of recovery.
- By the end of the fifth or, sometimes, by the end of the seventh minute of recovery the P wave amplitude and duration visually resemble the P wave in resting supine stage.
- Overall the P wave changes were dependent on changes in the heart rate over the previous stage.
- In 'normal' individuals, there is no electrocardiographic evidence of left and/or right atrial abnormality during maximal symptom-limited treadmill exercise using the Bruce protocol or during recovery of up to nine minutes.
References
- Einthoven W, (1908). Weiteres uber das Electrocardiogram. Arch Ges Physiol 122:517- 584
View at Publisher | View at Google Scholar - Irisawa H, Seyama I. The configuration of the P wave during mild exercise. Am Heart J 1966;71:467-472.
View at Publisher | View at Google Scholar - Simoons ML, Hugenholtz PG. (1975). Gradual changes of the ECG waveform during and after exercise in normal subjects. Circulation 52:570-577.
View at Publisher | View at Google Scholar - Deckers JW, Vinke RVH, Vas JR, Simoons ML. (1990). Changes in the electrocardiographic response to exercise in healthy women. Br Heart J 64:376-380.
View at Publisher | View at Google Scholar - Maganis JC, Gupta B, Gamic SH, et al. (2010). Usefulness of P wave duration to identify myocardial ischemia during exercise testing. Am J Cardiol 105:1365-1370.
View at Publisher | View at Google Scholar - Maganis JC, Drimer DA, Roja FB, et al. (2013). Enhanced recognition of ischemia by three-variable analysis of the exercise stress test. Journal of Electrocardiology 46(6):644-648.
View at Publisher | View at Google Scholar - Lloyd- Thomas HG. (1961) The effect of exercise on the electrocardiogram in healthy subjects. Br Heart J 23:260-270.
View at Publisher | View at Google Scholar - Baruteu I, Esen AM, Ozdeimer R, et al. (2009). Effect of treadmill exercise testing on P wave duration and dispersion in patients with isolated myocardial bridging. Int J Cardiovasc imaging 25:465-470.
View at Publisher | View at Google Scholar - Pandya A, Ellestad MH, Crump R. (1996). Time course of changes in P wave duration during exercise. Cardiology 84:343-346.
View at Publisher | View at Google Scholar - Surawicz B, Tavel M. (2008). Stress test. In: Surawicz B, knilans TK (eds). Chou’s electrocardiography in clinical practice. Saunders, Philadelphia; 221-255.
View at Publisher | View at Google Scholar - Thomas GS, Samtani SR, Ellestad MH. (2018). Interpretation of the ECG during exercise and recovery. In Thomas GS, Wann LS, Ellestad MH (eds) Elleastad’s Stress Testing. Oxford, New Delhi; 160-193.
View at Publisher | View at Google Scholar - Wsol A, Wydra W, Chmietewski M, et al. (2017). Increased sensitivity of prolonged P wave during exercise stress test in the detection of angiographically documented coronary artery disease. Cardiology Journal 24:159-166
View at Publisher | View at Google Scholar - Myrianthiefs MM, Ellestad MH, Startt Selvester RH, Crump R. (1991). Significance of signal-averaged P wave changes during exercise in patients with coronary artery disease and correlation with angiographic findings. Am J Cardiol 68:1619-1624.
View at Publisher | View at Google Scholar - Ahmad M, Blomquist G. P. (1978). wave changes during exercise in normal subjects and in patients with hemodynamic evidence of left atrial overload. J Electrocardiology 11:361-368.
View at Publisher | View at Google Scholar - Rautaharju PM, Punsar S, Blackburn H, et al. (1973). Wave form patterns in Frank lead resting and exercise electrocardiograms of healthy elderly men. Circulation 48:541-548.
View at Publisher | View at Google Scholar - Yogit Z, Akdur H, Ersanti M, et al. (2003). The effect of exercise to P wave dispersion and its evaluation as a predictor of atrial fibrillation. ANE 8:308-312.
View at Publisher | View at Google Scholar - Pascual M, Pascual PA, Soria F, et al. (2003). Effect of isolated obesity on systolic and diastolic left ventricular function. Heart 89:1152-1156.
View at Publisher | View at Google Scholar - Cartelli L, Rodrigues AN, Perez AJ, Vassalo DV. (2008). Blood pressure response to physical exertion in adolescents: influence of overweight and obesity. Arq Bras Cardiol 91:24-28.
View at Publisher | View at Google Scholar - Kokkinas P, Pittaras A. Narayan P. (2007). Exercise capacity and blood pressure association with left ventricular mass in prehypertensive individuals. Hypertension 49:55-61.
View at Publisher | View at Google Scholar - Wong ND, Franklin SS. (2017). Epidemiology of hypertension. In: Fuster V, Harrington RA, Narula J, Eapen ZJ (eds). The Heart. Mc Graw Hill, New York; 703-719.
View at Publisher | View at Google Scholar - Victor RG. (2019). Systemic hypertension: Mechanisms and Diagnosis In: Zipes DP, Libby P, Bonow RO, Mann DL, Tomaselli GF, (eds) Braunwald’s Heart Disease. Elsevier, Philadelphia; 910-927.
View at Publisher | View at Google Scholar - Boyer JK, Thanigaraj S, Schechtman KD, Perez JE. (2004). Prevalence of ventricular diastolic dysfunction in asymptomatic, normaltensive patients with diabetes mellitus. Am J Cardiol 93:870-875.
View at Publisher | View at Google Scholar - Otto CM. (2018). Ventricular diastolic filling and function. In: Otto CM. Textbook of clinical echocardiography. Elsevier, New Delhi; 178-203.
View at Publisher | View at Google Scholar - Oh JK, Seward JB, Tajik AJ. (2006). Assessment of diastolic function and diastolic heart failure. In: Oh JK, Seward JB, Tajik AH (eds). The Echo Manual. Lippincott & Wilkins, New Delhi; 120-142.
View at Publisher | View at Google Scholar - Chen MA. (2012). Aging changes seen on echocardiography. In: Otto CM (ed). The practice of clinical echocardiography. Elsevier, Philadelphia;774-790.
View at Publisher | View at Google Scholar - Granath A, Johnson B, Strandell T. (1964). Circulation in healthy old men studied by right heart catheterization at rest and during exercise in supine and sitting position. Acta Med Scand 176:425-446.
View at Publisher | View at Google Scholar - Mason RE, Likar Z. (1966). A new system of multiple lead exercise electrocardiography. Am Heart J 71:196-205.
View at Publisher | View at Google Scholar - Bruce R, Blackman J, Jones J, Strait J. (1963). Exercise testing in adult normal subjects and cardiac patients. Paediatrics 32:742-756.
View at Publisher | View at Google Scholar - Jain M, Nikonde C, Lin BA, et al. (2011). 85% of maximal age-predicted heart rate is not a valid endpoint for exercise treadmill testing. J Nucl Cardiol 18:1026-1035.
View at Publisher | View at Google Scholar - Takamura T, Onshi K, Sugimoto T, et al. (2008). Patients with a hypertensive response to exercise have impaired left ventricular diastolic function. Hypertens Res 31:257-263.
View at Publisher | View at Google Scholar - Tsiofis C. Chatzis D, Tsiachris D, et al. (2008). Exaggerated exercise blood pressure response is related to tissue Doppler imaging estimated diastolic dysfunction in the early stages of hypertension. J Am Soc Hypertens 2:158-164.
View at Publisher | View at Google Scholar - Grubb BP. (2017). Diagnosis and management of syncope. In: Fuster V, Harrington RA, Narula J, Eapen ZJ (eds). Hurst’s The Heart. Mc Graw Hill, New York; 2098-2112.
View at Publisher | View at Google Scholar - Lewis BI. (1953) The hyperventilation syndrome. Annals of Internal medicine 43:918-927.
View at Publisher | View at Google Scholar - Mittal SR, Mittal G. (2023) Heart rate response patterns during different stages of stress phase of exercise electrocardiography using Bruce protocol in normal persons. J Cardiol 7:DOJ 10:23880/oajc 16000172.
View at Publisher | View at Google Scholar - Mirvis DM, Goldberger AL. (2019). Electrocardiography. In: Zipes DP, Libby P, Bonow RO, Mann DL, Tomaselli GF (eds) Braunwald’s Heart Disease. Elsevier, Philadelphia; 117-151.
View at Publisher | View at Google Scholar - Gering LE, Kuilans TK, Surawicz B, Tavel ME. (2008). Atrial abnormalities. In: Surawicz B, Kuilans TK (eds). Chou’s Electrocardiography in Clinical Practice. Saunders, Philadelphia; 29-44.
View at Publisher | View at Google Scholar - Gabb GM, Mangoni A, Anderson CS, et al. (2016). Guideline for the diagnosis and management of hypertension in adults. Med J Aust 205:85.
View at Publisher | View at Google Scholar - Yokoyama M, Sakamoto A, Konno S, Sakakihara S. (1974). P wave changes on exercise in patients with isolated mitral stenosis. Am Heart J 87:15.
View at Publisher | View at Google Scholar - Holmgren A. (1956) Circulatory changes during muscular work in man with special reference to arterial and central venous pressure in the systemic circulation. Scand J Clin Lab Invest 8(suppl 24) 1-95.
View at Publisher | View at Google Scholar
