

Research Article | DOI: https://doi.org/10.31579/2834-8761/090
Concept for Automatic 3d Multi-Object Organ Bounds Detection and Segmentation in Abdominal Ct-Data
*Corresponding Author: Andre Mastmeyer, Digital Health Management, Aalen University, Germany.
Citation: Nico Zettler, Andre Mastmeyer, (2025), Concept for Automatic 3d Multi-Object Organ Bounds Detection and Segmentation in Abdominal Ct-Data, Clinical Endocrinology and Metabolism, 4(6); DOI:10.31579/2834-8761/090.
Copyright: © 2025, Andre Mastmeyer. This is an open access article distributed under the Creative Commons Attribution License, which permits unrestricted use, distribution, and reproduction in any medium, provided the original work is properly cited.
Received: 04 November 2025 | Accepted: 27 November 2025 | Published: 04 December 2025
Keywords: mTOR; mTORC1; mTORC2; Cell growth; Cancer; metabolic disorders; neurodegenerative diseases; targeted therapy
Abstract
The ability to generate 3D patient models in a fast and reliable way, is of great importance, e.g. for the simulation of liver punctures in a virtual reality simulation [1], [2], [3], [4]. The aim is to automatically detect and segment abdominal struc- tures in CT-scans. In particular among the selected organ group, the pancreas poses a challenge. We use a combination of random regression forests and U-Nets to detect bounding boxes and generate segmentation masks for five abdominal organs (liver, kidneys, spleen, pancreas). Training and testing is carried out on 50 CT-scans from various public sources.
1.Introduction
Virtual Reality (VR) intervention simulation for training and planning is slowly gaining importance in clinical teach- ing and routine. VR methods can be used for various tasks, ranging from training scenarios for the medical student and staff, to individual patient related simulations of planned operations. The necessary individual patient models should be available fast and be accurate to guarantee a plausible simulation. The first step in producing patient models is to ac- quire patient image data. This data will be used for the following steps in the modelling process. It is desirable to use high quality image data, because inaccuracies will be carried over to the resulting model. The next step is the coarse localisation of the organs to be modelled inside organ-specific volumes of interest (VOI) to simplify their subsequent segmentation. The aim of our study, is to automatically detect bounding boxes for organs in abdominal CT-data by a learning-from- example method. The detected bounding boxes are then used for segmentation. Detection of the abdominal organs can be a challenge, because of the variety of shapes these organs can have. The intensity based features of these organs are also challenging, because the intensity range of neighbouring organs often overlaps. We detected five abdominal organs (liver, right kidney, left kidney, pancreas, Regression-Forests to predict the location of organ bounding boxes in CT-data. Furthermore, we used the U-Net, proposed by Ronneberger et al. [6], to automatically segment organs. The training and testing is carried out on a database of 50 abdominal CT-scans, that had to be segmented beforehand.
2.Material And Methods
The database, that is used for training and testing, consisted of 50 CT-scans from three different sources: SLIVER071, LiTS2 and VISCERAL3. The data sets contained only abdominal CT-data. The sets also varied in quality and field of view, to capture the variability of organs and scans. The scans are not only different in the number of slices (64-861), thickness of slices (1-5mm) and Field-of-View (FoV), but also in image noise. This variability in the datasets is important, to ensure robustness vs. typical inference factors of clinical image data during training and application. All five target organs (liver, pancreas, left kidney, right kidney, spleen) are included in the scans. Only a small fraction of the segmentation maps contained all five target organs, thus manual structure segmentation was necessary frequently. The segmentation of the target structures is carried out by using ITKSnap 4.spleen), that are commonly used in simulations.
2.1.Definition Of Ground Truth Bounding Boxes
The segmentation maps associated to the CT-scans are the basis for the extraction of ground truth bounding boxes to be learned. A bounding box can be described as a cubical polyhedron that completely encloses an object. The form and size of a complex object is described by a much simpler hull object.The corresponding organ bounding boxes of each of the scans can be created by scanning the segmentation maps for coordinate direction extremes of label occurrence. To create a three-dimensional bounding box, for each coor- dinate direction (x,y,z), we iterate through the segmentation map and save the maximum and minimum limits where a label is encountered.
2.2.Training Of The Models
Our method is composed of two different machine learning approaches, random regression forests (RRF) and U-Nets. The RRF’s are used to detect organ bounding boxes in CT- data. The U-Nets make use of the detected bounding boxes and segment the organ contained in them.
2.2.1.Training Random Regression Forests For Bounding Box Detection
We use random regression forests to determine the location and extent of abdominal organs [5]. The main difference between random classification forests and RRFs, is the type of output that is predicted. While classification forests try to categorize objects, regression forests predict continuous values. Regression forests partition the data into manageable chunks to predict average values. As seen in Fig. 1, the method expects CT-scans and ground truth bounding boxes as input.A three-dimensional bounding box bc of an organ c can be described by using a six-dimensional vector bc = (bL, bR, bA, bP , bH, bF ) with coordinates in mm 5[5].
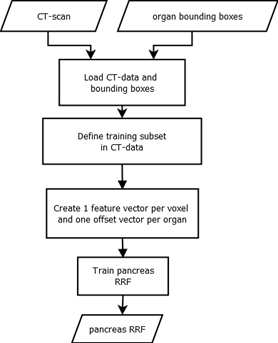
Figure 1: Training of a RRF: The inputs for the training process are CT-scans and ground truth bounding boxes of the targeted organs. We create one feature vector and one offset vector for each voxel that is part of a predefined me- dial cylinder subset in the scan [5]. The trained RRF is able to predict the offset between a voxel and an organ bounding box.
We tor (later: output) to the reference bounding box using the feature boxes.
c | c | c | c | c | c |
run over all voxels p = (xp, yp, zp), which are within a
specified radial distance (r = 5cm) from the scan medial axis. The distance d between such a voxel and each of the bounding box walls, can be calculated by using d(p) = (xp − xL, xp − xR, yp − yA, yp − yP , zp − zH, zp − zF ) and is saved as the offset-vector to be learned. In contrast to Criminisi et al. [5], we use only 50 feature boxes, that are evenly distributed on three spherical shells (r = 5 cm; 2.5 cm; 1.25 cm) to generate the input feature vector. These fea- ture boxes Fj are intended to capture the spatial and inten- sity context of the current voxel. For this purpose, the mean intensities of the feature boxes are calculated and saved in the feature vector. An example feature box is shown in Fig. 2. While training, the RRF learns the distance vec-
5L=left,R=right,A=anterior,P=posterior,H=head,
F=foot
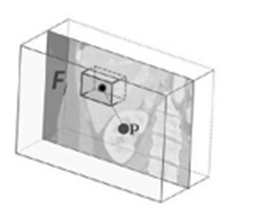
Figure 2: Example feature box: The feature box Fj is gen- erated in correlation to the current voxel and calculated the mean value of a 3D image section [5].
2.2.2.Training Of A U-Net For Semantic Segmentation
The training data for our U-Net consists of the expert seg- mentations and ground truth bounding boxes, as schema- tised in Fig. 3. The bounding boxes (VOIs) are then used to locally extract the intensity and label data from the CT- scans and their corresponding label maps. As input, the U- Net receives a VOI from the intensity data, while the same region within the label data is connected to the output. We use the U-Net architecture proposed by Ronneberger et al. [6], which consists of nine layers with four down- and up- scale steps. We trained one U-Net for each organ.
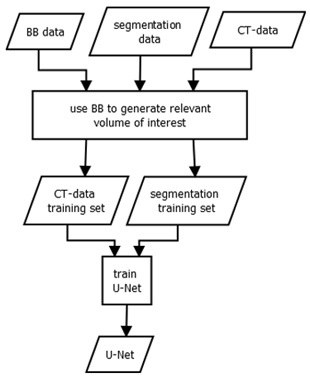
Figure 3: Training of a U-Net: The inputs for the training process are ground truth bounding boxes (BB), CT-scans and their corresponding segmentation maps. The box is ap- plied to the CT- and segmentation data to extract the rele- vant image region. Inside the organ VOIs, the segmentation is learned. The process results in an organ-wise U-Net, that can segment image regions.
2.3.Application Of The Models
In the first step, the organ specific RRFs predict the organ bounding box candidates. Then, a distance vec- tor is selected by majority voting and converted into a six-dimensional vector to describe the final organ-specific bounding box. Now, the U-Net model gets the corresponding bound- ing box as input. The U-Net uses the data contained inside the given bounding box, to segment the corresponding organ. The output is a segmentation map of the full target organ.
2.4.Evaluation
We used a five-fold Monte Carlo cross-validation based on a 30:20 (train:test) data split. The resulting segmentations are compared against the reference segmentations by using the Dice coefficient [7].
3.Results And Discussion
Table 1: shows the Dice coefficients achieved by our method for all five target organs. We compared our values to studies, that tried to segment the same organs with automatic methods. The best results show up for the liver and spleen. Both organs achieve a dice coefficient of 0.71. The segmentation of the pancreas are worst with only 0.32. The standard deviation is similar for all organs ranging from 0.26 to0.34. An example segmentation is presented in Fig. 4. Segmentation of unseen patient image data scan takes between 30 seconds and one minute depending on the size of the data, i.e. on an Intel-i7 processor with a NVIDIA GTX 1050 GPU.
Organ | Dice ± SD | Dice (Others) |
|---|---|---|
Liver | 0.71 ± 0.31 | 0.97 [8] |
Kidney (Right) | 0.55 ± 0.34 | 0.91 [9] |
Kidney (Left) | 0.67 ± 0.32 | 0.91 [9] |
Spleen | 0.71 ± 0.26 | 0.94 [10] |
Pancreas | 0.32 ± 0.28 | 0.74 [10] |
Table 1: Comparison of mean Dice coefficients and stan- dard deviation (SD) of our ensemble method with other one organ-focused methods.
4.Conclusion
We were able to detect organ bounding boxes automati- cally. Nonetheless, the overall position and extent of the predicted bounding boxes has to be improved to ensure a satisfying segmentation. Especially the prediction along the z-axis is not accurate enough and resulted in boxes that are displaced. Due to misalignment, some segmentation masks are cut off, because parts of the organ are missing.The standard deviations are too high, indicating highly varying results.In summary, the results of the current state of the segmentation method are affected by displaced bounding boxes and could not compete with the Dice coefficients of related studies. Though it is important to mention that most of the studies had more training data and are often focused on a single organ not addressing a group.Future works should focus on the accuracy and ro- bustness of the bounding box detection. The quality of the target segmentation depends heavily on the quality of the detected bounding boxes. We used predicted bounding boxes, to produce results for a completely automatic method.
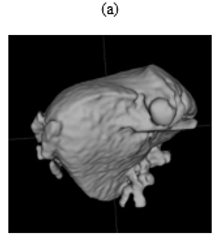
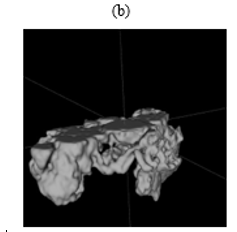
Figure 4: Example segmentations:
(a) A good segmentation of the liver, with some leakage into surrounding structures.
(b) A poor segmentation of the pancreas. The bounding box was shifted along the z-axis. This cut off the upper half of the pancreas, resulting in an incomplete segmentation. The segmentation also included parts of surrounding structures
Acknowledgement
Funding from German Research Foundation: DFG-MA 6791/1-1.
References
- Mastmeyer, D. Fortmeier, and H.(2016). Handels, “Ran- dom forest classification of large volume structures for visuo-haptic rendering in ct images.” p. 97842H.
View at Publisher | View at Google Scholar - Mastmeyer, M. Wilms, D. Fortmeier, J. Schröder, and H.(2016). Handels, “Real-time ultrasound simulation for training of us-guided needle insertion in breathing vir- tual patients,” in Studies in health technology and in- formatics, vol. 220. IOS Pressp. 219.
View at Publisher | View at Google Scholar - Mastmeyer, M. Wilms, and H. Handels.(2017).“Interpa- tient respiratory motion model transfer for virtual re- ality simulations of liver punctures,” Journal of World Society of Computer Graphics - WSCG, vol. 25, no. 1,pp. 1–10, 2017.
View at Publisher | View at Google Scholar - Mastmeyer, M. Wilms, and H. Handels.(2018). “Population-based respiratory 4d motion atlas construction and its application for vr simulations of liver punctures,” in SPIE Medical Imaging 2018: Im- age Processing, vol. 10574. International Society for Optics and Photonicsp. 1057417.
View at Publisher | View at Google Scholar - Criminisi, D. Robertson, O. Pauly, B. Glocker, E. Konukoglu, J. Shotto.(2013). Decision Forests for Com- puter Vision and Medical Image Analysis. London: Springer.
View at Publisher | View at Google Scholar - O. Ronneberger, P. Fischer, and T. Brox.(2015). “U-net: Con- volutional networks for biomedical image segmen- tation,” Med Image Comput Comput Assist Interv – MICCAI 2015, p. 234–241.
View at Publisher | View at Google Scholar - H. Meine, G. Chlebus, M. Ghafoorian, I. Endo, and A. Schenk.(2018). “Comparison of u-net-based convolutional neural networks for liver segmentation in CT,” CoRR.
View at Publisher | View at Google Scholar - F. Isensee and K. H. Maier-Hein.(2019). “An attempt at beat- ing the 3d u-net,”.
View at Publisher | View at Google Scholar - E. Gibson, F. Giganti, Y. Hu, E. Bonmati, S. Bandula, K.et.al.(2018). “Automatic multi-organ seg- mentation on abdominal ct with dense v-networks,” IEEE Transactions on Medical Imaging, vol. 37, no. 8,pp. 1822–1834, Aug 2018.
View at Publisher | View at Google Scholar - Taha and A. Hanbury.(2015). “Metrics for evaluating 3d medical image segmentation: analysis, selection, and tool,” BMC med imaging, vol. 15, no. 1, p. 29.
View at Publisher | View at Google Scholar
