

Research Article | DOI: https://doi.org/10.31579/2835-8376/044
Atmospheric pattern correlates of human brain structure
1Neuro-SysMed, Department of Neurology, Haukeland University Hospital, Norway.
2Department of Health and Functioning, Western Norway University of Applied Sciences, Norway.
3Mohn Medical Imaging and Visualisation centre, Department of Radiology, Haukeland University Hospital, Norway.
4Center for Precision Psychiatry, University of Oslo and Oslo University Hospital, Norway
5K.G. Jebsen Centre for Neurodevelopmental disorders, University of Oslo, Norway.
6Department of Psychology University of Oslo,Norway.
7Alfred Wegener Institute, Helmholtz Centre for Polar and Marine Research, Bremerhaven,Germany.
*Corresponding Author: Max Korbmacher, Neuro-SysMed, Department of Neurology, Haukeland University Hospital, Norway, Department of Health and Functioning, Western Norway University of Applied Sciences, Norway , Mohn Medical Imaging and Visualisation centre, Department of Radiol
Citation: Max Korbmacher, Ole A. Andreassen , Lars T. Westlye, Ivan I. Maximov, Ivan Kuznetsov., (2025). Title: Atmospheric pattern correlates of human brain structure, Clinical Research and Reviews.4(3); DOI: 10.31579/2835-8376/044.
Copyright: © 2025, Max Korbmacher, this is an open-access article distributed under the terms of the Creative Commons Attribution License, which permits unrestricted use, distribution, and reproduction in any medium, provided the original author and source are credited.
Received: 05 May 2025 | Accepted: 21 May 2025 | Published: 19 June 2025
Keywords: .
Abstract
Climate change increasingly impacts human health, yet its neurobiological effects remain poorly understood. Analysing structural neuroimaging data of 30,831 UK participants (4,294 with follow-up assessments), we show that ambient weather conditions (warm, sunny, low precipitation and wind speed) associate with brain structure variations that exceed contributions from Alzheimer's disease genetic risk scores and self-reported mental health. These findings establish atmospheroc patterns as measurable environmental correlates of brain structure and reveal new pathways for understanding climate-brain interactions.
Introduction
Despite growing concerns about climate change impacts on human health and well-being,1,2 evidence linking atmospheric conditions to brain structure remains limited. This knowledge gap persists partly due to the challenges of integrating large-scale meteorological data with neuroimaging cohorts. Atmospheric variability (temperature, precipitation, solar radiation, wind) may influence brain structure through multiple pathways, including effects on multiple bodily systems,2 physical activity,3 vitamin D synthesis,4 circadian rhythms.5 Given projections of increased climatic variability and extreme weather events,6 understanding neurobiological sensitivity to atmospheric exposures could inform preventive strategies and help anticipate neurological health burdens associated with climate change.1 Hence, an improved understanding of associations between atmospheric patterns and brain structure is essential as environmental conditions continue to shift both globally and locally. Here, we provide a first step towards investigating atmospheric-brain associations, establishing brain structural correlates of meteorological conditions in the United Kingdom.
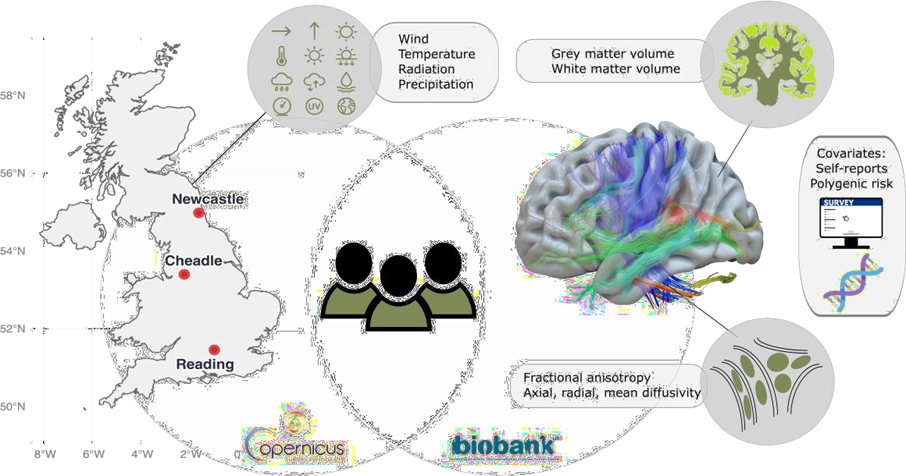
Figure:1: Study design: Monthly meteorological data were linked to structural brain imaging (N = 30,831), yielding measures of grey matter volume, white matter volume, and white matter microstructure (diffusiometrics). Genetic risk scores and self-reported mental health data served as comparison variables. We linked atmospheric data averaged over the United Kingdom for the month precedingthe health and MRI assessments (Fig. 1). The derived averaged atmospheric indices were joined with individuals’ brain metrics for all 30,831 participants at baseline (see Table 1 in the Online Methods for an overview of key variables), and for n=4,294 at follow-up (Supplemental Table 1). As a comparison to atmospheric variables as predictors of brain structure, we also used self-reports of mental health, correspondingly polygenic risk scores (PGRS) of Alzheimer’s Disease, considering the sample age. our analyses, all corrected for assessment site, household income, sex, age, intracranial volume, and surface holes, revealed that atmospheric variables presented stronger associations (median±mean absolute deviation (MAD) |β| = 0.013±0.013) with brain structure than PGRS of Alzheimer’s disease (AD, median±MAD |β| = 0.006±0.001), and on average similar to self-reports of neuroticism and depression (|β| = 0.013±0.012; see Fig. 2; Supplemental Data 1). However, the strongest associations were found for atmospheric variables for associations between fractional anisotropy and a) 10 metre wind speed (standardized effect size β=-0.059, 95% CI [-0.068, -0.049], pFDR=1.78*10-30), and surface downward UV radiation (β=0.055, 95% CI [0.045, 0.064], pFDR=4.42*10-27).
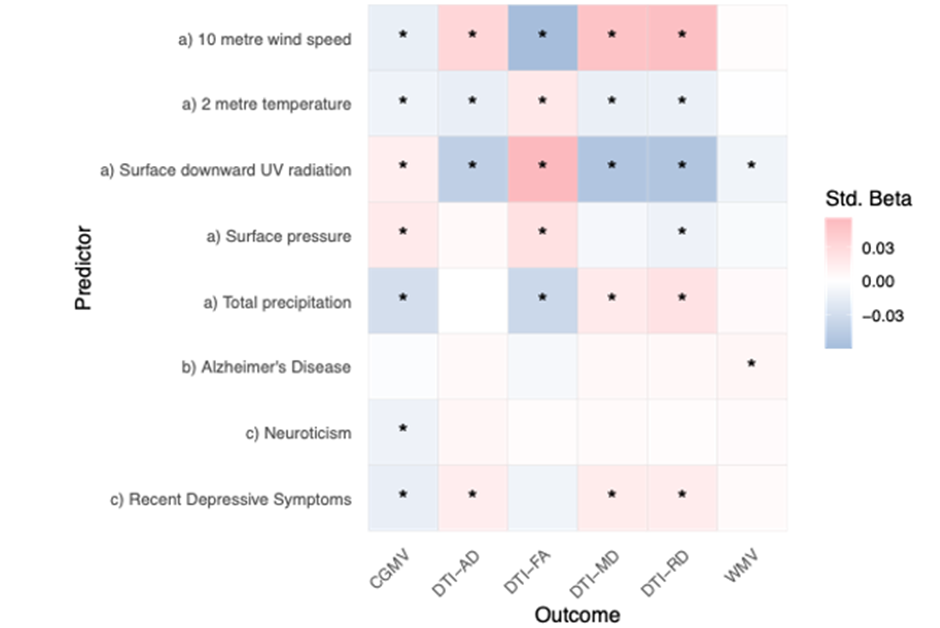
Figure:2: Associations between brain structural and a) atmospheric indicators, b) polygenic risk of Alzheimer’sdisease, and c) self-reports of recent depression and neuroticism.PGRS = polygenic risk score, CGMV = cortical grey matter volume, DTI = diffusion tensor imaging, AD = axial diffusivity, FA = fractional anisotropy, MD = mean diffusivity, RD = radial diffusivity, WMV = white matter volume. Std. Beta = standardized beta or regression coefficients. The associations suggest that better weather (lower precipitation, lower wind speed, higher short- and long-wave radiation and higher surface pressure) was associated with greater cortical volume and higher fractional anisotropy (indicating anisotropy of water diffusion along a single direction and thereby structural integrity of axonal bundles), in addition to lower axial, radial and mean diffusivity (indicating the magnitude of diffusivity, along or perpendicular to the fibre bundles or their average) (Fig. 2). Likelihood Ratio Tests suggested that adding AD PGRS or self-reported outcomes on recent depression and neuroticism did not improve models predicting brain structure. Changes tothe model were non-significant when adding the covariates (p>0.05) in 65 of 90 (27.78%) of the models with FDR-adjustment for multiple comparisons. Adding neuroticism to the models explaining cortical volume presented the largest contribution [26.12].
Online Methods
Sample
We extracted multimodal (T1-weighted and diffusion-weighted images) MRI data from the
UK Biobank database.16 We excluded participants diagnosed with any mental and
behavioural disorder (ICD-10 category F), disease of the nervous system (ICD-10 category G),
and disease of the circulatory system (ICD-10 category I), or stroke. Weather data, PGRS and
self-reported data were merged, resulting in N = 30,831 included participants (sample
overview at baseline: Table 1; at follow-up: Supplemental Table 1).
| Characteristic Cheadle, N = 18,0181 | Newcastle, N = 8,2601 | Reading, N = 4,5531 | ||
| Demographics | ||||
| Age (years) | 65 (58, 70) | 66 (60,72) | 68 (61, 73) | |
| Male (sex) | 8,752 (49%) | 3,888 (47%) | 2,204 (48%) | |
| Income in £1,000 | ||||
| Less than 18 | 1,930 (11%) | 905 (11%) | 269 (5.9%) | |
| 18-31 | 3,889 (22%) | 1,667 (20%) | 710 (16%) | |
| 31-52 | 5,089 (28%) | 2,308 (28%) | 1,072 (24%) | |
| 52-100 | 4,512 (25%) | 2,152 (26%) | 1,425 (31%) | |
| More than 100 | 928 (5.2%) | 563 (6.8%) | 702 (15%) | |
| Don't know | 336 (1.9%) | 145 (1.8%) | 92 (2.0%) | |
| No answer | 1,192 (6.7%) | 502 (6.1%) | 276 (6.1%) | |
Intracranial Volume (litres) | 1.5 (1,4, 1.6) | 1.5 (1.4, 1.6) | 1.5 (1.4, 1.6) | |
| Surface Holes | 53 (38, 75) | 50 (36, 74) | 44 (33, 62) | |
| Fractional Anisotropy | 0.46 (0.45, 0.47) | 0.46 (0.44, 0.47) | 0.46 (0.45, 0.47) | |
| Mean Diffusivity | 0.89 (0.87, 0.91) | 0.89 (0.87, 0.91) | 0.89 (0.87, 0.91) | |
| Radial Diffusivity | 0.65 (0.62, 0.67) | 0.65 (0.62, 0.67) | 0.64 (0.62, 0.67) | |
| Axial Diffusivity | 1.38 (1.36, 1.40) | 1.37 (1.35, 1.39) | 1.38 (1.36, 1.40) | |
| Cortical Volume (litres) | 0.4 (0.4, 0.5) | 0.4 (0.4, 0.5) | 0.4 (0.4, 0.5) | |
Table 1: Sample characteristics at baseline.
MRI Acquisition and Processing
The MRI acquisition protocol has been described previously (https://www.fmrib.ox.ac.uk/ukbiobank/protocol/).16 Starting with the diffusion MRI data, we processed these imaging data using an optimised pipeline,17 which entails corrections of noise, Gibbs ringing, susceptibility-induced and motion distortions, and eddy current induced artifacts. Isotropic 1 mm3 Gaussian smoothing was applied using fslmaths (FSL version 6.0.1).18 We estimated diffusion tensors at each voxel, or Diffusion Tensor Imaging (DTI),19 but used a signal decomposition in order to take into account kurtosis imaging as well. This procedure has been shown to lead to more robust and reproducible DTI estimates.20 We employed Tract-based Spatial Statistics21 for the analysis of white matter integrity. The first step was to align the fractional anisotropy (FA) images to standard MNI space using non-linear registration. A mean FA image and corresponding skeleton were then generated from the aligned data. Each diffusion parameter map was subsequently projected onto this mean FA skeleton. We then averaged the respective DTI metrics FA, axial, radial and mean diffusivity across the white matter skeleton. We used the YTTRIUM method22 for quality control of diffusion MRI scalars. For YTTRIUM global diffusion MRI scalar metrics are converted into 2-dimensional format using a structural similarity extension of each scalar map to their mean image to create a 2D distribution of image and diffusion parameters. Non-clustering values are then excluded. For T1-weighted MRI data, we used FreeSurfer version 5.3.0 for surface-based reconstruction and estimation of brain grey and white matter and intra-cranial volumes, in addition surface holes, which have previously been shown to be crucial to avoid bias in large sample brain image analyses.23 We used Euler numbers24 to exclude images when the Euler number exceeded three standard deviations from the mean. Finally, to allow for more spatially specific assessment of brain structure, we parcellated both grey and white matter. For the T1-weighted MRI-derived volumes, we used theDesikan-Killiany Atlas25 to obtain regional estimates of brain volumes, leading to a total of 68 brain features based on the 34 regions of interest for each brain hemisphere. We used the 20 tracts from the John Hopkins University atlas26 which are based on a probabilistic WM atlas. We averaged across the 20 tracts for each of the 4 DTI parameters, totalling 80 values per individual.
Polygenic risk
We estimated the polygenic risk score (PGRS) for each participant with available genomic data, using LDPred227 with default settings. As input for the PGRS, we used the summary statistics from a recent genome-wide association study (GWAS) of Alzheimer’s Disease (AD),28 using a minor allele frequency of 0.05. We selected AD PGRS as it is based on a well-powered GWAS28 and has, as the most common neurodegenerative disease, real-world applicability, particularly considering the examined ageing sample. A previous study also presented relatively strong associations between a PGRS of late onset AD and brain structure.29
Self-reported measures of mental health
We assessed two self-reported measures reflecting state- and trait-level characteristics of mental health: recently experienced depression and the personality trait neuroticism.30 To assess depression, we used the Recent Depressive Symptoms (RDS-4) score (range: 4-16), which contains four questions covering four dimensions of depression: mood, disinterest,restlessness, and tiredness. The score is computed as a sum of the 4-point Likert-like responses from the four items. The Eysenck Personality Questionnaire-Revised Short Form, which includes 12 items, was used to assess neuroticism. A sum score was computed from the binary responses to the 12 items, where symptoms were either present or absent. Bothscores were previously validated against other corresponding scales using test-retest data of the UK Biobank imaging subsample and recommended to be used to assess imaging biomarkers in the context of mental health.30
Atmospheric data
Monthly meteorological data were obtained from the ERA5 reanalysis dataset,31 specifically the monthly averaged single-level product prior scanning, accessed via the Copernicus Climate Data Store.32 These data are based on historical observations with a numerical weather prediction model to produce a spatially and temporally complete reconstruction of the atmosphere over extended periods (~70+ years). Unlike raw observational records, which are irregularly distributed in space and time, reanalysis provides globally gridded fields on a regular mesh, serving as a proxy for the actual atmospheric state. This datasetcaptures both long-term climate trends and natural variability, making it suitable for investigations of climate patterns, extremes, and variability. In contrast, ensemble means of general circulation models primarily represent the forced climate signal, with much of the natural variability averaged out. Importantly, we used ERA5 reanalysis as a representation of observed atmospheric conditions, rather than relying on weather forecasts or purely modelled climate projections. For each parameter, spatial means were computed over the broader United Kingdom area (60°–50°N, 7°W–1°E) to derive regional time series for analysis. The greater grid was selected for more accurate measures of atmospheric variables (in contrast to smaller scale local parameters). As a result, the following climate metrics were used for the analysis: the wind speed 10 metres above the Earth’s surface in m/s (10metre wind speed), the 2-metre temperature in Kelvin, 24-hour surface downward ultraviolet (UV) radiation in J*m-2, the surface pressure in Pascal, and the total precipitationin kg m-2 s-1.
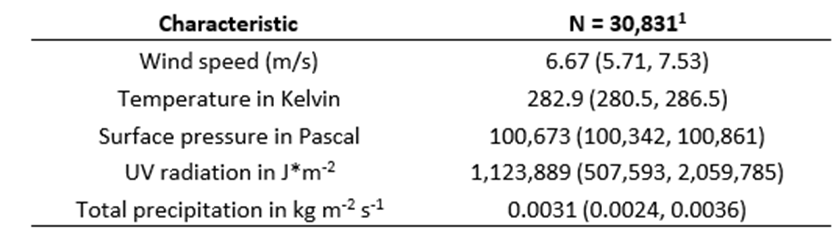
Table 2: Atmospheric characteristics at baseline.
Statistical Analyses
First, we ran simple linear models predicting brain variables (B, cortical thickness, fractional
anisotropy, radial, axial, and mean diffusivity) from atmospheric patterns or weather variables (W, see Weather Data section) at baseline, controlling for site, household income, sex, age, intracranial volume (ICV), and surface holes (SH). ICV has previously been shown to influence DTI33 and volumetric scalars34 and needs therefore to be controlled for.
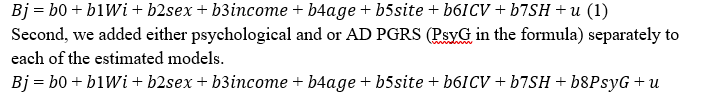
We then used likelihood ratio tests to examine whether the added psychological and
genetic factors improved model performance. As supplemental analyses (results are reported in the Supplement), we first show additional baseline and longitudinal associations of PGRS of common psychiatric disorder using formula 2. Second, we report the outcomes from linear mixed effect models mirroring the 2formula 1 but adding follow-up data and a random effect of participant to examine the longitudinal effects for participants for which two scans were available. Among the brain variables Bj, we also added brain age. Brain age models were trained on the cross-sectional data not entailing the participants from the longitudinal set using a simple linear regression model. This procedure, including strong model performance, has also been described previously.35 Third, we used the extracted tracts and brain volume average from the Desikan-Killiany atlas to run the same models as presented in formula 1, with the region-and tract-level metrics as the respective dependent variable. The alpha level set at 0.05 was Benjamini-Hochberg corrected to control for the false discovery rate. For comparability, we reported standardised regression coefficients.
Ethics approval
This study was approved by the Norwegian Ethics Commission REK 567301, PVO 17/21624 (Ole Andreassen). The study has been conducted using UKB data under Application 27412. UKB has received ethics approval from the National Health Service National Research Ethics Service (ref 11/NW/0382).
Declaration of interests
OAA has received a speaker's honorarium from Lundbeck, Janssen, Otsuka and Lilly, and is a consultant to Coretechs.ai and Precision Health. LTW is a minor shareholder of baba.vision.
Data availability
Analysis code can be found at https://github.com/MaxKorbmacher/WeatherBrain.
ERA5 monthly averaged data on single levels are available from the Copernicus Climate Data
Store (https://cds.climate.copernicus.eu/datasets/reanalysis-era5-single-levels-monthly-
means) (accessed 07 July 2025). Contains modified Copernicus Climate Change Service information 2025. Neither the European Commission nor ECMWF are responsible for any use that may be made of the Copernicus information or data it contains.
References
- Chen, S. et al. Long-term impacts of heatwaves on accelerated ageing. Nat. Clim. Chang.
View at Publisher | View at Google Scholar - Ebi, K. L. et al. Hot weather and heat extremes: health risks. The Lancet 398, 698–708 (2021).
View at Publisher | View at Google Scholar - Aspvik, N. P. et al. Do weather changes influence physical activity level among older adults? - The Generation 100 study. PLoS One 13, e0199463 (2018).
View at Publisher | View at Google Scholar - Buell, J. S. et al. 25-Hydroxyvitamin D, dementia, and cerebrovascular pathology in elders receiving home services. Neurology 74, 18–26 (2010).
View at Publisher | View at Google Scholar - Dunster, G. P. et al. Daytime light exposure is a strong predictor of seasonal variation in
View at Publisher | View at Google Scholar - sleep and circadian timing of university students. Journal of Pineal Research 74, e12843 (2023).
View at Publisher | View at Google Scholar - Chan, C. B., Ryan, D. A. & Tudor-Locke, C. Relationship between objective measures of
View at Publisher | View at Google Scholar - Edwards, N. M. et al. Outdoor Temperature, Precipitation, and Wind Speed Affect Physical
View at Publisher | View at Google Scholar - Activity Levels in Children: A Longitudinal Cohort Study. J Phys Act Health 12, 1074–1081
View at Publisher | View at Google Scholar - (2015). Twohig-Bennett, C. & Jones, A. The health benefits of the great outdoors: A systematic
View at Publisher | View at Google Scholar - review and meta-analysis of greenspace exposure and health outcomes. Environ Res 166,
View at Publisher | View at Google Scholar - Kelly, P. et al. Systematic review and meta-analysis of reduction in all-cause mortality
View at Publisher | View at Google Scholar - from walking and cycling and shape of dose response relationship. International Journal
View at Publisher | View at Google Scholar - of Behavioral Nutrition and Physical Activity 11, 132 (2014).
View at Publisher | View at Google Scholar - Zhou, M., Xie, Y., Wang, C., Shen, L. & Mauzerall, D. L. Impacts of current and climate
View at Publisher | View at Google Scholar - induced changes in atmospheric stagnation on Indian surface PM2.5 pollution. Nat Commun 15, 7448 (2024).
View at Publisher | View at Google Scholar - Block, M. L. & Calderón-Garcidueñas, L. Air pollution: mechanisms of neuroinflammation and CNS disease. Trends Neurosci 32, 506–516 (2009).
View at Publisher | View at Google Scholar - Power, M. C., Adar, S. D., Yanosky, J. D. & Weuve, J. Exposure to air pollution as a potential contributor to cognitive function, cognitive decline, brain imaging, and dementia: A systematic review of epidemiologic research. NeuroToxicology 56, 235–253
View at Publisher | View at Google Scholar - Shi, L. et al. Long-term effects of PM2·5 on neurological disorders in the American Medicare population: a longitudinal cohort study. Lancet Planet Health 4, e557–e565 (2020). Wang, M.-Y. et al. The within-subject stability of cortical thickness, surface area, and brain volumes across one year. 2024.06.01.596956 Preprint at
View at Publisher | View at Google Scholar - Alfaro-Almagro, F. et al. Image processing and Quality Control for the first 10,000 brain imaging datasets from UK Biobank. NeuroImage 166, 400–424 (2018).
View at Publisher | View at Google Scholar - Maximov, I. I., Alnæs, D. & Westlye, L. T. Towards an optimised processing pipeline for diffusion magnetic resonance imaging data: Effects of artefact corrections on diffusion metrics and their age associations in UK Biobank. Human Brain Mapping 40, 4146–4162 (2019).
View at Publisher | View at Google Scholar - Smith, S. M. et al. Advances in functional and structural MR image analysis and implementation as FSL. NeuroImage 23, S208–S219 (2004).
View at Publisher | View at Google Scholar - Basser, P. J., Mattiello, J. & LeBihan, D. MR diffusion tensor spectroscopy and imaging. Biophys J 66, 259–267 (1994).
View at Publisher | View at Google Scholar - Henriques, R. N., Jespersen, S. N., Jones, D. K. & Veraart, J. Toward more robust and reproducible diffusion kurtosis imaging. Magnetic Resonance in Medicine 86, 1600–1613 (2021).
View at Publisher | View at Google Scholar - Smith, S. M. et al. Tract-based spatial statistics: voxelwise analysis of multi-subject diffusion data. NeuroImage 31, 1487–1505 (2006).
View at Publisher | View at Google Scholar - Maximov, I. I. et al. Fast qualitY conTrol meThod foR derIved diffUsion Metrics (YTTRIUM) in big data analysis: UK Biobank 18,608 example. HBM 42, 3141–3155 (2021).
View at Publisher | View at Google Scholar - Elyounssi, S. et al. Addressing artifactual bias in large, automated MRI analyses of brain development. Nat Neurosci 28, 1787–1796 (2025).
View at Publisher | View at Google Scholar - Rosen, A. F. et al. Quantitative assessment of structural image quality. NeuroImage 169, 407–418 (2018).
View at Publisher | View at Google Scholar - Desikan, R. S. et al. An automated labeling system for subdividing the human cerebral cortex on MRI scans into gyral based regions of interest. NeuroImage 31, 968–980 (2006).
View at Publisher | View at Google Scholar - Mori, S., Wakana, S., Nagae-Poetscher, L. & Van Zijl, P. MRI atlas of human white matter. American Journal of Neuroradiology 27, 1384 (2006).
View at Publisher | View at Google Scholar - Privé, F., Arbel, J. & Vilhjálmsson, B. J. LDpred2: better, faster, stronger. Bioinformatics 36, 5424–5431 (2021).
View at Publisher | View at Google Scholar - Wightman, D. P. et al. A genome-wide association study with 1,126,563 individuals identifies new risk loci for Alzheimer’s disease. Nat Gen 53, 1276–1282 (2021).
View at Publisher | View at Google Scholar - Tank, R. et al. Association between polygenic risk for Alzheimer’s disease, brain structure and cognitive abilities in UK Biobank. Neuropsychopharmacol. 47, 564–569 (2022).
View at Publisher | View at Google Scholar - Dutt, R. K. et al. Mental health in the UK Biobank: A roadmap to self-report measures and neuroimaging correlates. Human Brain Mapping 43, 816–832 (2022). ERA5 monthly averaged data on single levels from 1940 to present.
View at Publisher | View at Google Scholar - Buontempo, C. et al. The Copernicus Climate Change Service: Climate Science in Action. Bulletin of the American Meteorological Society 103, E2669–E2687 (2022).
View at Publisher | View at Google Scholar - Eikenes, L., Visser, E., Vangberg, T. & Håberg, A. K. Both brain size and biological sex contribute to variation in white matter microstructure in middle-aged healthy adults. Hum
View at Publisher | View at Google Scholar - Brain Mapp 44, 691–709 (2022). Sanchis-Segura, C., Ibañez-Gual, M. V., Aguirre, N., Cruz-Gómez, Á. J. & Forn, C.
View at Publisher | View at Google Scholar - Effects of different intracranial volume correction methods on univariate sex differences in grey matter volume and multivariate sex prediction. Sci Rep 10, 12953 (2020).
View at Publisher | View at Google Scholar - Korbmacher, M. et al. Cross-Sectional Brain Age Assessments Are Limited in Predicting Future Brain Change. Human Brain Mapping 46, e70203 (2025).
View at Publisher | View at Google Scholar
