

Review Article | DOI: https://doi.org/10.31579/2834-8486/023
Students’ Perceptions About Examination And Result At The Secondary Level
- AHMAD W
- MAHMOOD MA
- ALI S
- SIDDIQA M
- ASLAM T 1*
Institute of Agriculture Extension, Education and Rural development, University of Agriculture, Faisalabad, Pakistan
*Corresponding Author: ASLAM T, Institute of Agriculture Extension, Education and Rural development, University of Agriculture, Faisalabad, Pakistan.
Citation: ASLAM T*., AHMAD W., MAHMOOD MA., ALI S., SIDDIQA M., AZIZ MS. (2024). STUDENTS’ PERCEPTIONS ABOUT EXAMINATION AND RESULT AT THE SECONDARY LEVEL, A Case Report And Review Of Literature, Biomedical and Clinical Research.3(4); DOI:10.31579/2834-8486/023
Copyright: © 2024, ASLAM T, this is an open-access article distributed under the terms of the Creative Commons Attribution License, which permits unrestricted use, distribution, and reproduction in any medium, provided the original author and source are credited.
Received: 18 July 2024 | Accepted: 14 August 2024 | Published: 29 August 2024
Keywords: Students; Perceptions; Examination; Result; Secondary Level
Abstract
The exam system is an essential part of the educational system. It encourages students to compete positively. Without valid and reliable exams, it is impossible to determine the efficacy and reliability of the educational system. The present study entitled ‘’Students’ Perception Study on Recent Examination and Results at Secondary Level in Tehsil Chiniot.” According to sis.punjab.gov.pk, 16 secondary boys’ schools are in the study area. 5 male schools had been selected conveniently and matric students at those schools were taken as the population of the study. The target population was 313 students of matriculation level. The sample size of 121 students was determined by using the online available software www.serveysystem.comi.e. With a confidence level of 95% and a confidence interval of 7%. Sample from the target population was taken through a convenient sampling technique. A well-structured questionnaire was developed for data collection. Analysis of the data was done by using Statistical Package for Social Sciences (SPSS). Result of the study shows that more than one-third (36.4%) of the respondents were 14 years old. More than one fourth (32.2%) of the respondents were 15 years old. More than half (52.9%) of the respondents were science students. More than half (100%) of the respondents belonged to rural areas. Having less instructiveness between questions of different sections has a mean value 4.20. The mean value of this statement lies between the Agree to strongly agree and tending towards the agree and ranked at 1st position according to the mean value. Supply type questions were too long to solve in the mentioned time, with a mean value 4.13. The mean value of this statement lay between the Agree to strongly agree and tending towards the Agree and ranked at 2nd position according to mean value. It is concluded that the assessment and evaluation from the student's perception, evaluate and appraise. The research results show that students' attitudes about evaluation greatly impact how they approach learning and studying. Student should make a realistic revision schedule. Student should find a revision style that suits you. Student should customize their notes to make them more personal.
Introduction
The evaluation system significantly impacts students' learning processes and results, and examination is one of the most significant components of higher education (Jaap et al., 2021). At the secondary level, students' perceptions about examination and results can vary widely depending on their experiences and perspectives. There are some common perceptions that students may have: Exam anxiety, many students experience anxiety and stress leading up to exams. They may worry about being unprepared or not doing well, negatively impacting their performance. Importance of results: Students may view exam results as critical to their future academic and career success. They may feel pressure to perform well and get high grades to get into a good college or university or pursue their desired career path. Fairness of exams: some students may perceive exams as unfair, feeling that they are not a true reflection of their knowledge and abilities. They may feel that exams only test their memorization skills rather than their critical thinking or problem-solving abilities. Confidence boost: On the other hand, some students may view exams as an opportunity to showcase their knowledge and skills. Doing well on an exam can boost their confidence and motivate them to continue working hard. Comparison with peers: Students may compare their exam performance with their peers, affecting their perceptions of their abilities and self-esteem. Relevance of material: Students may question the relevance of the material they are tested on in exams. They may feel that some of the topics covered are not important or useful in real life (Ferreira and Santoso 2018). Educational institutions use assessment to determine whether students are eligible for significant certifications. As a result, evaluation is crucial to the continued functioning of educational institutions J. Phys. Biomed. Biol. Sci. Volume, 2: 13 Ahmad et al., (2023) 2 (Danielsen et al., 2010). Exams are used to assess how well students have learned. It should be based on qualitative and quantitative methodologies to evaluate the students' performance thoroughly. According to the criteria, the processes used in the assessment process must be legitimate and reliable. Evaluation of student performance is the primary goal of assessment. In addition to being outdated, Pakistan's examination system cannot thoroughly assess students' performance. Pakistan's testing process only assesses students' memory. They are not assessed in all areas of learning (Collier, 2004). Examinations are conducted to assess a student's rank of learning. Both quantitative and qualitative approaches should be practiced precisely to evaluate student achievement. According to the standards, the methods used in the evaluation process must be trustworthy and genuine. The main aim of the assessment is to evaluate student performance. Pakistan's exam structure is not only outdated, but it is also unable to evaluate students’ performance. The testing regime in Pakistan primarily evaluates students' memory. Not all of their learning is evaluated (Kamhouropoulos, 2014). Students between the ages of 15 and 17 receive the “Higher Secondary School Certificate” (HSSC), commonly known as the intermediate. In contrast, those between 13 and 15 receive the Secondary School Certificate (SSC), the matric. A modest number of students also take the O and A level examinations for the international general certificate in education. The national evaluations and certificates are administered in Pakistan by over 20 examination boards. They are called the local boards and designated as Boards of Intermediate and Secondary Education (BISE). They mostly function on a regional basis. O and A level exams are offered by “Cambridge International Examinations”. Because these exams are expensive, only a select few students from rich families can take them. The BISE tests have a negative reputation, and various forms of malpractice and corruption connected to exams are routinely mentioned in Pakistani media. The need for revamping Pakistan's school-leaving test was reiterated in the National Education Policy of 2009, as has been well-documented in at least 35 official publications between 1959 and 1993. There are allegedly two major problems with the current system. One which is not considered trustworthy, to start. Second, the current structure encourages and rewards rote learning rather than emphasizing knowledge intake, understanding, and application (Vitasari et al., 2010).
Slogan of education for all completely deteriorate by the negative effects of corona. Stress and mental disorders phenomenon has become a great social problem in modern era. Inadequate mental condition does not occur automatically. Stress due to isolation among the students undoubtedly directly affects the teaching pedagogies and teaching behavior during the teaching process. The first thing about stress is the negative feelings that were cause negative behavior and student mistakes. The parents who work in the health department and work on the frontline create fear for their children. Coronavirus seriously affects students' education, such as schools and tuition closing. Due to the coronavirus, the quality of education also decreased. Students become lazy and forget the basic concept of education. This situation changed the demand and importance of education for the people of society (Dickerson, 2005).
Methodology
The present study entitled “A students’ perception study on recent examination and results at secondary level in Tehsil Chiniot.” According to sis.punjab.gov.pk, 16 secondary boys’ schools in the study area. 5 male schools had been selected conveniently. Matric students at those schools were taken as the study population. The target population is 313 students of matriculation level. The sample size of 121 students was determined by using the online available software www.serveysystem.comi.e. with a confidence level of 95% and a confidence interval of 7%. Sample from the target population was taken through a convenient sampling technique. A wellstructured questionnaire was developed for data collection. Data analysis will be done using Statistical Package for Social Sciences (SPSS).
Results And Discussion
This chapter contains an analysis and descriptions of the data. This chapter presents collected data along with its analysis. The purpose of the results and discussion is to present an analysis and interpretation of data relating to the research problems under investigation and to explain any new understanding or, after considering findings.
Demographic Characteristics
Demographic characteristics like age, education in years, source of income in rupees, family background, qualification of father and mother plays an imperative role in the knowledge of the students. These demographic characteristics directly or indirectly affect the respondents' academic goals. Respondents also affected by these characteristics regarding different qualifications and student’s student-teacher relationships.
Table 1 Distribution Of The Respondents According To Their Demographic Attributes
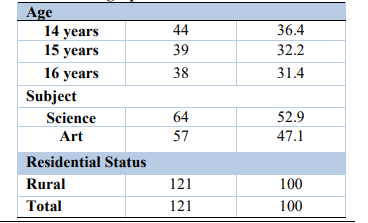
Table 1 shows that overone-third (36.4%) of the respondents were 14 years old. Over one-fourth (32.2%) of the respondents were 15. About one-third (31.4%) of the respondents were 16 years old. It depicts that more than half (52.9%) of the respondents were students of science subjects while less than half (47.1%) were art subjects. It describes the percentage of the residential status of the respondents. It shows that (100%) of the respondents belonged to the rural areas.
Perception of students regarding the quality of paper provided in the board exams
Exams are used to assess how well students have learned. It should be based on qualitative and quantitative methodologies to evaluate the students' performance thoroughly. According to the criteria, the processes used in the assessment process must be legitimate and reliable. Evaluation of student performance is the primary goal of assessment. In addition to being outdated, Pakistan's examination system can not thoroughly assess students' performance. Pakistan's testing process only assesses students' memory. They are not assessed in all areas of learning (Chamberlain et al., 2011; Branson and Comell, 2009). The responses of the respondents were coded through the Likert scale:
1. Strongly Disagree
2. Disagree
3. Neutral/ Undecided
4. Agree
5. Strongly Agree
Table 2: Distribution of the respondents according to the quality of paper provided in the board exams
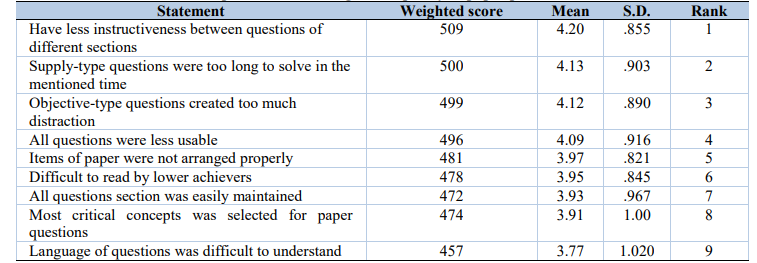
Table 2 depicts that having less instructiveness between questions of different sections has a mean value of 4.20.
The mean value of this statement lies between the Agree to strongly agree and tending towards the Agree and ranked at 1st position according to the mean value. Supply-type questions were too long to solve in the mentioned time, with a mean value 4.13. The mean value of this statement lies between the Agree to strongly agree and tending towards the Agree and ranked at 2nd position according to the mean value. Objective-type questions created too much distraction and have a mean value 4.12. The mean value of this statement lay between the Agree to strongly agree and tending towards the Agree and ranked at 3rd position according to the mean value. All questions were less usable, with a mean value 4.09. The mean value of this statement lies between the Agree to strongly agree and tending towards the Agree and ranked at 4th position according to the mean value. Paper items were not arranged properly and had a mean value of 3.97. The mean value of this statement lies between the undecided to agree and tending towards the Agree and ranked at 5th position according to mean value. Difficult to read by lower achievers is a mean value 3.95. The mean value of this statement lies between the undecided to agree and tending towards the Agree and ranked at 6th position according to the mean value. All questions section was easily maintained and had a mean value 3.93. The mean value of this statement lies between the undecided to agree and tending towards the Agree and ranked at 7th position according to mean value. Most critical concepts selected for paper questions have a mean value 3.91. The mean value of this statement lies between the undecided to agree and tending towards the Agree and ranked at 8th position according to the mean value. Language of the questions was difficult to understand, having a mean value 3.70. The mean value of this statement lies between the undecided to agree and tending towards the Agree and ranked at 9th position according to the mean value. Yang and Cornelius (2004) examined how students assessed the usefulness of online learning based on their individual experiences using qualitative research approaches. Studies, including interviews and observation, were conducted on three students. They enjoy the adaptability, affordability, accessibility to electronic materials, ease of internet connection, and well-designed classroom interface, according to the research's findings. Instructors' delayed feedback, inability to offer technical assistance, inability to motivate themselves, isolation, dull teaching methods, and poorly designed course content all contributed to negative student experiences.
Perception regarding the policy of recent board exams
Slogan of education for all completely deteriorates because of the negative effects of corona. Stress and mental disorders have become great social problems in the modern era. Inadequate mental condition does not occur automatically. Stress due to isolation among the students undoubtedly directly affects the teaching pedagogies and teaching behavior during the teaching process. The first thing about stress is the negative feelings that cause negative behavior and student mistakes. The parents working in the health department and working on the frontline create fear for their children. Coronavirus seriously affects students' education, such as schools and tuition closing. Due to coronavirus the quality of education also decreased. Students become lazy and forget the basic concept of education. This situation changed the demand and importance of education for the people of society (Fordjouret al., 2020). The responses of the respondents were coded through the Likert scale:
1. Strongly Disagree
2. Disagree
3. Neutral/ Undecided
4. Agree
5. Strongly Agree
Table 3:Distribution of the respondents according to the policy of recent board exams
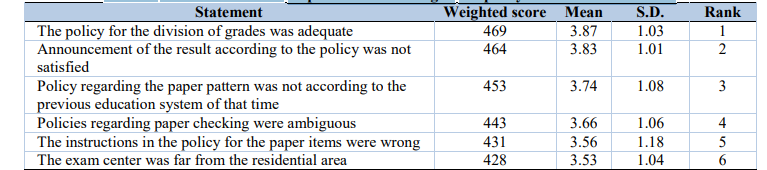
Table 3 depicts that the policy for the division of grades was adequate, having a mean value 3.87.
The mean value of this statement lies between the undecided to agree and tending towards the Agree and ranked at 1st position according to the mean value. The announcement of the result according to the policy was unsatisfactory, and hasa mean value of 3.83. The mean value of this statement lies between the undecided to agree and tending towards the Agree and ranked at 2nd position according to the mean value. Policy regarding the paper pattern was not according to the previous education system of that time, having a mean value 3.74. The mean value of this statement lies between the undecided to agree and tending towards the Agree and ranked at 3rd position according to the mean value. Policies regarding the paper checking were ambiguous, having mean value 3.66. The mean value of this statement lies between the undecided to agree and tending towards the Agree and ranked at 4th position according to mean value. The instructions in the policy for the paper items were too wrong to have a mean value 3.56. The mean value of this statement lies between the undecided to agree and tending towards the Agree and ranked at 5th position according to mean value. The Exam center was far from the residential area and had a mean value of 3.53. The mean value of this statement lies between the undecided to agree and tending towards the Agree and ranked at 6th position according to mean value. Struyven et al. (2005) studied the assessment and evaluation from the student's perception and appraisal. The research results show that students' attitudes about evaluation greatly impact how they approach learning and studying. On the other hand, how students approach their studies affects how they view evaluation and assessment. Results imply that students have strong opinions about various forms of assessment and evaluation. Students prefer multiplechoice examinations over essay-style questions in this regard. Nonetheless, students dispute the "fairness" of these well-known evaluation strategies when contrasted with more creative assessment techniques.
Conclusion and recommendation
It is concluded that the assessment and evaluation from the student's perception, evaluate and appraise. The research results show that students' attitudes about evaluation greatly impact how they approach learning and studying. On the other hand, how students approach their studies affects how they view evaluation and assessment. Results imply that students have strong opinions about various forms of assessment and evaluation. Students prefer multiplechoice examinations over essay-style questions in this regard. Nonetheless, students dispute the "fairness" of these well-known evaluation strategies when contrasted to more creative assessment techniques. Researchers studied the twelve schools using random samples from each district, eight from rural regions, and four from metropolitan areas. Students in these schools' fifth-grade classes who took the test in April 2006 were included in the sample. For the goal of J. Phys. Biomed. Biol. Sci. Volume, 2: 13 Ahmad et al., (2023) 5 gathering data, two questionnaires based on a fivepoint Likert scale were employed. Chi-square was employed as a statistical test to assess the data. The majority of respondents, including teachers and administrative staff members, favored the new examination system and believed that the SOLO Taxonomy would enhance the validity of the class V examination and improve student learning. Training sessions for teachers were organized before introducing the SOLO Taxonomy, and it was observed that they used it in the classroom and checked papers. Most instructors had the appropriate training before implementing the new test system. According to the majority's views, students should make a realistic revision schedule so they cannot face any trouble managing their educational and personal lives. Partial majority suggested that students find a revision style that increases their command of topics.
References
- 1. ACS TRAUMA QUALITY PROGRAMS BEST PRACTICES GUIDELINES FOR TRAUMA CENTER RECOGNITION OF [Internet]. [cited 2023 Aug 1].
View at Publisher | View at Google Scholar - Branson, C. E., & Cornell, D. G. (2009). A comparison of self and peer reports in the assessment of middle school bullying. Journal of Applied School Psychology, 25(1), 5-27.
View at Publisher | View at Google Scholar - Chamberlain, S., Daly, A. L., & Spalding, V. (2011). The fear factor: Students’ experiences of test anxiety when taking A-level examinations. Pastoral Care in Education, 29(3), 193-205. Collier, M. S. (2004). Stress in College. Common Causes of Stress in College. Journal International Social Development, Psycology and Biology. 5: 23- 52.
View at Publisher | View at Google Scholar - Danielsen, A. G., Samdal, O., Hetland, J., & Wold, B. (2009). School-related social support and students' perceived life satisfaction. The Journal of educational research, 102(4), 303-320.
View at Publisher | View at Google Scholar - Dickerson, D. (2005). A Survey of Examination Phobia amongst at Secondary School Level. Journal of Education and Research 1(1): 4-12. Ferreira, A., & Santoso, A. (2008). Do students’ perceptions matter? A study of the effect of students’ perceptions on academic performance. Accounting & Finance, 48(2), 209-231.
View at Publisher | View at Google Scholar - Fordjour, G. A., Chan, A. P. C., & Fordjour, A. A. (2020). Exploring potential predictors of psychological distress among employees: a systematic review. International Journal of Psychiatry Research, 2(7), 1-11.
View at Publisher | View at Google Scholar - Jaap, A., Dewar, A., Duncan, C., Fairhurst, K., Hope, D., & Kluth, D. (2021). Effect of remote online exam delivery on student experience and performance in applied knowledge tests. BMC Medical Education, 21(1), 1-7. Kambouropoulos, A. (2014). An examination of the adjustment journey of international students studying in Australia. The Australian Educational Researcher, 41(3), 349-363.
View at Publisher | View at Google Scholar - Karin, J., Van,G., Kamp,L., JoostenD., Brinke,T., and L. Kester. (2019).Students’ perceptions of assessment quality related to their learning approaches and learning outcomes.4: 72-82.
View at Publisher | View at Google Scholar - Struyven, K., Dochy, F., & Janssens, S. (2005). Students’ perceptions about evaluation and assessment in higher education: A review. Assessment & evaluation in higher education, 30(4), 325-341.
View at Publisher | View at Google Scholar - Vitasari, P., Wahab, M. N. A., Othman, A., Herawan, T., & Sinnadurai, S. K. (2010). The relationship between study anxiety and academic performance among engineering students. Procedia-Social and Behavioral Sciences, 8, 490-497. Yang, Y., & Cornelius, L. F. (2004). Students' perceptions towards the quality of online education: A qualitative approach. Association for Educational Communications and Technology, 861-877.
View at Publisher | View at Google Scholar
