

Review Article | DOI: https://doi.org/10.31579/2835-7949/039
Gender Difference in Nutritional Knowledge, Dietary Pattern and Nutritional Status of Undergraduates In Al Hawash University, Syria
1Department of Pharmacy, Tartous University, Syria
2Faculty of medicine, Tartous University, Syria
3Faculty of pharmacy, Al-Hawash Private University, Syria
*Corresponding Author: Samer Younes, Department of Pharmacy, Tartous University, Syria.
Citation: Samer Younes, Abdulrahman Shbani, Bana Shbani., (2025), Gender Difference in Nutritional Knowledge, Dietary Pattern and Nutritional Status of Undergraduates In Al Hawash University, Syria,4(5); DOI: 10.31579/2835-7949/039
Copyright: © 2025, Samer Younes. This is an open access article distributed under the Creative Commons Attribution License, which permits unrestricted use, distribution, and reproduction in any medium, provided the original work is properly cited.
Received: 01 October 2025 | Accepted: 15 October 2025 | Published: 29 October 2025
Keywords: nutrition; nutritional knowledge; diets; BMI
Abstract
Introduction:
Limited nutritional knowledge during early life can contribute to unhealthy eating habits, increasing the risk of obesity and related non-communicable diseases later in life. This study investigated gender differences in nutritional knowledge, dietary patterns, and the prevalence of overweight/obesity among students at Hawash University, a private tertiary institution in Syria.
Materials and Methods:
A total of 129 students were selected from the university’s six colleges. Data were collected using a semi-structured questionnaire covering personal and lifestyle characteristics, dietary habits, and physical activity levels. Body Mass Index (BMI) was calculated from weight and height measurements. Descriptive statistics and chi-square tests were used for data analysis, with significance set at p < 0.05.
Results:
The mean age of the participants was 20.89 ± 3.89 years. A majority (64%) received a monthly allowance of ≥500,000 Syrian pounds, while 79.9% and 78% had fathers and mothers, respectively, with university degrees. About 40.2% did not engage in physical exercise. Over two-thirds (69.2%) consumed fewer than three meals per day, and 59.8% skipped breakfast. Dietary diversity scores were average (71.0%) or high (20.6%) among participants. The mean BMI was 24.60 ± 3.70, with 63.6% having a BMI <25 and 36.4% classified as overweight/obese (BMI ≥25). Nutritional knowledge levels were low (10.7%), average (72.9%), or high (16.4%). No significant gender differences were observed in BMI, nutritional knowledge, or dietary diversity.
Conclusion:
The findings highlight insufficient nutritional knowledge, poor dietary habits, and a high prevalence of overweight/obesity among university students. There is a critical need for enhanced nutrition education and health promotion initiatives targeting this population.
Introduction
Limited nutritional knowledge during early life can contribute to unhealthy eating habits, increasing the risk of obesity and related non-communicable diseases later in life. This study investigated gender differences in nutritional knowledge, dietary patterns, and the prevalence of overweight/obesity among students at Hawash University, a private tertiary institution in Syria.
Materials and Methods:
A total of 129 students were selected from the university’s six colleges. Data were collected using a semi-structured questionnaire covering personal and lifestyle characteristics, dietary habits, and physical activity levels. Body Mass Index (BMI) was calculated from weight and height measurements. Descriptive statistics and chi-square tests were used for data analysis, with significance set at p < 0>
Results:
The mean age of the participants was 20.89 ± 3.89 years. A majority (64%) received a monthly allowance of ≥500,000 Syrian pounds, while 79.9% and 78% had fathers and mothers, respectively, with university degrees. About 40.2% did not engage in physical exercise. Over two-thirds (69.2%) consumed fewer than three meals per day, and 59.8% skipped breakfast. Dietary diversity scores were average (71.0%) or high (20.6%) among participants. The mean BMI was 24.60 ± 3.70, with 63.6% having a BMI <25>
Conclusion:
The findings highlight insufficient nutritional knowledge, poor dietary habits, and a high prevalence of overweight/obesity among university students. There is a critical need for enhanced nutrition education and health promotion initiatives targeting this population.
Keywords: nutrition; nutritional knowledge; diets; BMI
Introduction:
Adolescence and early adulthood represent a critical developmental stage for establishing health-promoting behaviors and preventing chronic diseases [1]. During this transitional period, young adults gain independence in making dietary and lifestyle choices that may lead to unhealthy eating patterns and physical inactivity. University students constitute a particularly vulnerable population where targeted health promotion programs could significantly reduce future risks of obesity, cardiovascular diseases, diabetes, hypertension, and other lifestyle-related conditions [1]. The lack of adequate nutritional knowledge frequently results in poor food selection, negatively impacting students' nutritional status and contributing to growing public health challenges of malnutrition and obesity in academic settings. Multiple interrelated factors influence these adverse health outcomes, including sedentary behaviors [2], insufficient nutrition education [3], excessive snacking [4], breakfast omission [5], higher personal disposable income [6], elevated parental socioeconomic standing [7], and biological sex differences [8]. This research investigation focuses on analyzing gender-based disparities in dietary diversity scores, nutrition-related knowledge, and anthropometric measurements among undergraduates at a private Syrian university in Homs. The study outcomes may provide critical evidence for developing tailored nutritional interventions and educational programs aimed at improving dietary practices and overall health status within university student populations.
Materials and methods
Study Design and Setting
This cross-sectional study was conducted among 129 undergraduate students at Al Hawash University in Syria. The university comprises five colleges: College of Medicine and Health Sciences, College of Law, College of Social and Management Sciences, College of Engineering, and College of Pharmacy, offering both undergraduate and postgraduate programs.
Study Population and Sampling
The sample size was determined using a 95% confidence interval (Z) with 0.05 precision, based on an estimated 50% prevalence of eating patterns, yielding a minimum required sample of 129 participants. This sample was proportionally allocated across the colleges: Medicine and Health Sciences (40), Law (6), Social and Management Sciences (10), Engineering (14), and Pharmacy (59). Participants were further distributed across departments and by gender within each college.
Data Collection Instruments and Procedures
Data were collected using a structured interviewer-administered questionnaire with five sections addressing: (1) socio-demographic characteristics (age, gender, parental education, monthly allowance), (2) lifestyle factors, (3) feeding patterns, (4) anthropometric measurements, and (5) nutrition knowledge and dietary diversity.
Anthropometric measurements followed standardized protocols:
- Weight was measured to the nearest 0.1 kg using a calibrated Harson bathroom scale (model H89 DK BLUE FA00333), with participants removing shoes and extraneous items, standing motionless in an upright position.
- Height was measured to the nearest 0.1 m using a stadiometer, with participants standing shoeless in full upright position.
- BMI was calculated as weight (kg)/height (m²) and classified per WHO guidelines: <18>
Data Analysis
The collected data were analyzed to assess nutritional knowledge, dietary patterns, and weight status among participants, with particular attention to gender-based differences.
Dietary Diversity Assessment
Dietary diversity was evaluated using the Dietary Diversity Score (DDS), which quantifies the number of distinct food groups consumed within the previous 24 hours (FAO, 2007). Based on 24-hour dietary recall data, we categorized foods into nine groups: (1) starchy staples, (2) dark green leafy vegetables, (3) vitamin A-rich fruits/vegetables, (4) other fruits/vegetables, (5) organ meats, (6) meat/fish, (7) eggs, (8) legumes/nuts/seeds, and (9) dairy products. Scores were classified as: low (<3>
Nutrition Knowledge Evaluation
Nutrition knowledge was assessed through 15 domain-specific questions (1 point per correct answer). Total scores were categorized as: good (11-15), average (6-10), or low (0-5).
Data Analysis Methods
All data were processed using SPSS version 20. After data cleaning (identifying and addressing missing/incomplete entries), we performed descriptive analyses (frequencies/percentages for categorical variables) and chi-square tests to examine variable associations.
Ethical Considerations
The study protocol received approval from multiple ethics committees (Al Hawash, Tartous, and Homs Universities, plus affiliated hospitals). All participants provided written informed consent after receiving study details. Participation was voluntary, anonymous, and uncompensated. Data collection occurred during non-academic periods to avoid disruption. Strict confidentiality measures were maintained throughout.
Results:
Participant Characteristics
The cohort (n=129) had a mean age of 20.89±3.89 years, with 68.2% >20 years old. Gender differences emerged in maternal education (83.5% of males vs. 74.8% of females had university-educated mothers). Financially, 49.6% received ≥500,000 Syrian pounds monthly, while 36.0% received <500>
Lifestyle Patterns
Most participants abstained from alcohol (62.1%) and smoking (59.7%), but consumed soft drinks (76.7%). Physical activity levels were low, with only 17.3% exercising daily and 40.2% reporting no weekly exercise.
Key tables
(Tables 1-2) present detailed distributions of these characteristics. The results demonstrate notable variations in socioeconomic factors and health behaviors across the study population.
Charateristics Male Female Total Freq (%) Freq (%) Freq (%) |
Age (years) <20> ≥20 35 (76.1) 33 (39.8) 68 (52.8) |
Monthly allowance <500> ≥500,000.00 SP 21 (45.7) 43 (51.8) 64 (49.6) |
Father education Post-secondary or less 16 (34.7) 27 (32.5) 43 (33.3) University degree 30 (65.3) 56 (67.5) 86 (66.7) |
Mother education Post-secondary or less 13 (28.3) 34 (40.9) 47 (36.4) University degree 33 (71.7) 49 (59.1) 82 (63.6) Mean age (male)=21.20±2.06. Mean age (female)=20.71±1.78. Mean age (total)=20.89 ±3.89 |
Table 1: Respondents’ personal characteristics
Charateristics Male Female Total Freq (%) Freq (%) Freq (%) |
Taking alcohol Yes 18 (58.2) 31 (25.2) 49 (37.9) No 28 (41.8) 52 (74.8) 80 (62.1) |
Smoking Yes 24 (30.4) 28 (20.7) 52 (40.3) No 22 (69.6) 55 (79.3) 77 (59.7) |
Taking soft drink Yes 29 (74.7) 70 (76.3) 99 (76.7) No 17 (25.3) 13 (23.7) 30 (23.3) |
Body exercise Daily 10 (16.5) 23 (17.8) 33 (25.5) Occasionally 15 (57.0) 30 (36.3) 45 (34.9) Rarely 21 (26.5) 30 (45.9) 51 (39.6) |
Body exercise/week None 21 (31.6) 30 (45.2) 51 (39.6) 1-3 times 15 (49.4) 30 (41.5) 45 (34.9) ≥4 times 10 (19.0) 23 (13.3) 33 (25.5) |
Hour of body exercise/day <1> ≥1 26 (49.4) 31 (31.9) 57 (44.2) |
Table 2: Lifestyle characteristics of respondents
Feeding habits of respondents
Table 3 shows the feeding habits of the respondents. About one third (30.8%) took three or more meals in a day and 72.0% skipped meals. The major meal skipped was breakfast (59.8%) and 64.5% took it ≤3 times in a week. Females took more meals than males.
Charateristics Male Female Total Freq (%) Freq (%) Freq (%) Number of meals/days <3> 3 17 (21.5) 29 (14.1) 46 (35.6) >3 2 (6.3) 23 (18.5) 25 (19.3) Skipping meals Yes 30 (69.6) 48 (73.3) 78 (60.4) No 16 (30.4) 35 (26.7) 51 (39.6) Meal skipped Breakfast 32 (67.0) 44 (55.6) 66 (51.1) Lunch 14 (33.0) 32 (37.8) 56 (43.5) Dinner 0 (0.0) 7 (6.6) 7 (5.4) |
Number breakfast/week ≤3 24 (68.4) 44 (62.2) 68 (52.7) 4-5 17 (21.5) 28 (28.1) 45 (34.9) 6-7 5 (10.1) 11 (9.7) 16 (12.4)
|
Table 3: Feeding habits of respondents
Dietary diversity of respondents
Figure 1 reveals the dietary diversity of the respondents with 71.0% having medium dietary diversity with more females (74.8%) than males (64.6%).
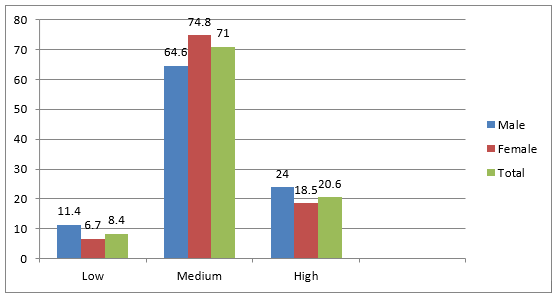
Figure 1: Dietary diversity of respondents
Nutritional knowledge of respondents
Figure 2 shows the nutritional knowledge of the respondents. Only 16.4% of the respondents had good knowledge while majority (72.9%) had average knowledge.
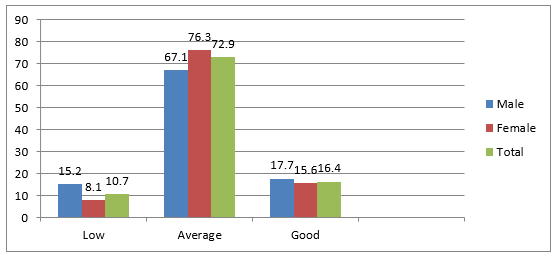
Figure 2: Nutritional knowledge of respondents
Weight perception and Body Mass Index of respondents
ssRespondents’ weight perception and BMI are shown in tables 4. Majority (70.5%) believed that they had normal weight, 23.2% were satisfied with their weight and 34.1% were dissatisfied. Only 37.4% were trying to lose weight. More than one third (36.5%) of the respondents were overweight/obese and 6.1% were underweight.
Charateristics Male Female Total Freq (%) Freq (%) Freq (%) |
Weight perception Underweight 14 (30.4) 21 (25.3) 35 (27.1) Normal weight 29 (63.0) 62 (74.7) 91 (70.5) Overweight 3 (7.6) 0 (0.00) 3 (2.4) Obesity 0 (0.0) 0 (0.0) 0 (0.0) |
Satisfied with current weight Very satisfied 16 (34.7) 31 (23.0) 47 (36.4) Satisfied 4 (8.71) 26 (56.3) 30 (23.3) Dissatisfied 20 (43.6) 24 (17.0) 44 (34.1) Very dissatisfied 6 (13.0) 2 (3.7) 8 (6.2) |
Tried to lose weight in the last 12months Yes 12 (29.1) 26 (42.2) 38 (27.8) No 34 (70.9) 57 (57.8) 91 (72.2) |
BMI Underweight (<18> Normal weight (18.5-24.99) 39 (84.7) 67 (80.7) 106 (82.2) Overweight (25.0-29.99) 3 (6.51) 5 (6.10) 8 (6.2) Obesity (≥30) 0 (0.00) 0 (0.00) 0 (0.00) |
Table 4: Weight perception and BMI of respondents
Gender differences in dietary diversity, nutritional knowledge and Body Mass Index of respondents
Tables 5 shows the gender differences in dietary diversity, nutritional knowledge and BMI of the respondents. There was no gender difference in dietary diversity, nutritional knowledge and body mass index of the respondents.
Gender Male Female Total Chi-square p-value N (%) N (%) N
|
Dietary diversity Low (<3> Average (3-5) 21 (33.6) 41 (66.4) 62 Good (6-7) 16 (43.2) 34 (56.8) 49 Knowledge Low (0-5) 13 (52.2) 11 (47.8) 24 3.022 0.221 Average (6-10) 23 (34.0) 43 (66.0) 66 Good (11-15) 10 (40.0) 30 (60.0) 40 BMI <18> 18.5-24.99 39 (37.4) 67 (62.6) 106 25.0-29.99 3 (43.2) 5 (56.8) 8 ≥30.0 0 (00.0) 0 (0.00) 00
|
Table 5: Dietary diversity, nutritional knowledge and BMI by gender of respondents
Discussion:
Personal Lifestyle and Characteristics
The study participants were primarily adolescents and young adults from high socioeconomic backgrounds, mirroring trends observed at Igbinedion University, Nigeria, where 85% of students had parents with tertiary education [7]. These students received higher monthly allowances compared to their counterparts in public universities [5,6,10] and exhibited sedentary lifestyles similar to Saudi Arabian university students [9]. However, our participants showed higher physical activity levels than students at Al-Hawash University (where only 4% exercised 3–5 times weekly) [2] or Pakistani students in Bahawalpur (2% vigorously active) [3]. Notably, those with higher allowances frequently consumed energy-dense snacks, a known risk factor for overweight/obesity.
Feeding Patterns and Dietary Diversity
While over half of students consumed ≥3 meals daily, nearly two-thirds skipped meals—particularly breakfast (50% of 129 participants). This aligns with findings among Indian [14] and Nigerian students in Sagamu (>66% skipped breakfast) [8], though lower than other Nigerian studies (≤50%) [12,13]. Meal skipping, especially breakfast, correlates with weight gain and cardiovascular risks [15,16], while snack consumption associates with overweight in Nigerian university students [1].
Dietary diversity was average for nearly half of participants—higher than Indian students with low diversity (35%) [14] but lower than another Indian cohort (61% high diversity) [17]. Unlike the gender disparities observed in India [14,26], our study found no gender differences in diversity scores. Poor dietary variety links to abnormal weight gain [14], and dietary habits significantly associate with obesity in private university students [18].
Nutritional Knowledge
Approximately half of participants (predominantly female) demonstrated average nutritional knowledge—lower than Nigerian public university students (52–75% good knowledge) [2,11].
Overweight and Obesity:
About 6.2% of the students were overweight and obese.
This prevalence is lower than that seen in University of Uyo, Nigeria students with a prevalence of 42% [19], and lower than the prevalence among university students in Saudi Arabia at 52% [9]. It is also lower than the prevalence among Saudi Arabian university students in 2022 and Egyptian students in 2020, which were at 37% [20]. Additionally, it is lower than Indian students at 26% [3], Sudanese students at 14% [21], and other Nigerian students, which were approximately one-quarter [5,6,8].
A higher percentage of female participants were overweight and obese, but this difference was not statistically significant. This aligns with the results reported by Riggs [22] in American students and students at the University of Uyo, Nigeria [19].
Weight Perception:
Approximately 5.2% of the respondents believed they were overweight or obese, a lower figure than the 26% reported among American college students.[22]. Over a third of the students expressed dissatisfaction with their current weight, contrasting sharply with the 50% rate among American students. The percentage of those desiring to shed weight was also lower at 65%, in comparison to American students. [1,22].
The difference between the number of students who were overweight and obese and those who perceived they were overweight and obese is minimal.
This suggests that a significant portion of the students were aware of their weight status.
Gender differences in Dietary Diversity, Nutritional Knowledge and Body Mass Index:
It was noted that there were no notable variations in dietary diversity, nutritional Knowledge, and BMI between genders.
Several studies have reported conflicting findings compared to the current study. Samuel et al. [23] discovered a significant gender difference in BMI among secondary school adolescents in Owo LGA, Nigeria. Sholeye et al. [8] found that females were more likely to be overweight and obese, while Magulod Jr and Capili [24] and Alkazemi [25] observed higher weight in males. Kumar et al. [14] noted a significant gender difference in dietary diversity score among Indian students, with males having a higher score than females. In 2019, males were found to have higher weight than females among university students in Asia [24]. A study at the University of Nigeria, Nsukka, revealed that females had significantly better nutrition knowledge than males [2]. In Saudi Arabia, male students were more obese than females [9], while in Sagamu, Nigeria, females were more obese than males among university students of Health and Allied Sciences [8]. Additionally, dietary diversity scores were higher in males than females among students in Karnataka, India [26].
References
- Samer Y. (2024). Gender Difference in Nutritional Knowledge, Dietary Pattern and Nutritional Status of Undergraduates in Tartous University, Syria. Nutri Food Sci Int J.13(2): 555857.
View at Publisher | View at Google Scholar - Okeke CC, Agwu UOR, Umeobieri AK, Azodo C, Idoko AC, et al. (2020). Dietary habits and physical exercise among undergraduate students in Southeast Nigeria. Nigerian Journal of Medicine 29(1): 29-37
View at Publisher | View at Google Scholar - Rana S, Ahmad K, Asif HM, Ahmad K, Wadood A, et al. (2020). Nutritional Assessment among Undergraduate Students of the Islamia University of Bahawalpur. J Food Nutr Disor 9(5):1000286
View at Publisher | View at Google Scholar - Aljefree NM, Shatwan IM, Almoraie NM (2022). Impact of the Intake of Snacks and Lifestyle Behaviors on Obesity among University Students Living in Jeddah, Saudi Arabia. Healthcare 10(2): 400
View at Publisher | View at Google Scholar - Olatona FA, Onabanjo OO, Ugbaja RN, Nnoaham KE Adelekan DA (2018). Dietary habits and metabolic risk factors for non-communicable diseases in a university undergraduate population. Journal of Health, Population and Nutrition 37(1): 21
View at Publisher | View at Google Scholar - Lano MT (2020). Assessment of Nutritional Status of Undergraduate Students in Tertiary Institutions in Lagos State. International Journal of Innovative Research in Education, Technology & Social Strategies 7(1): 26-40
View at Publisher | View at Google Scholar - Omage K, Omuemu VO (2019). Factors associated with the dietary habits and nutritional status of undergraduate students in a private university in Southern Nigeria. Niger J Exp Clin Biosci 7(1): 7-16
View at Publisher | View at Google Scholar - Sholeye OO, Omisore ME, Animasahun VJ (2021). Meal Skipping Among Undergraduate Health and Allied Sciences Students in Sagamu, Nigeria. Afr. J. Biomed. Res 24(3): 459-464.
View at Publisher | View at Google Scholar - Shehata SF, Althubait BM, AboTamrah AA, Alotaibi KM, Amer KA, et al. (2021) Prevalence of Obesity among King Khalid University students in, 2020, Saudi Arabia. World Family Medicine/Middle East Journal of Family Medicine 19 (4): 18-25.
View at Publisher | View at Google Scholar - Udoh ES, Offor OS (2020). Dietary diversity among female students in public universities of Akwa Ibom State, Nigeria. Nigerian Agricultural Journal 51(2): 425-433.
View at Publisher | View at Google Scholar - Dada SO, Oyewole OE, Desmennu AT (2020). Knowledge as Determinant of Healthy-Eating Among Male Postgraduate Public Health Students in a Nigerian Tertiary Institution. International Quarterly of Community Health Education 42(1):103-114
View at Publisher | View at Google Scholar - Ikujenlola AV, Adekoya TS (2020). Nutritional status and feeding habits of females in public and private Universities in Osun state, Southwestern, Nigeria. Heliyon 6(9): e05023.
View at Publisher | View at Google Scholar - Ogundele AE, Aleru EO, Bodunde IO, Gbenro OE (2023). Drivers of Food Choice, Meal Pattern, and Lifestyle Habits among Undergraduate Students in Lead City University, Ibadan, Oyo State, Nigeria. World Nutrition 14(2): 66-74
View at Publisher | View at Google Scholar - Kumar A, Ayub A, Roy R, Rai A, Ameta B, et al. (2020). Assessment of Diet Diversity and Eating Pattern of Undergraduate Students: A Pan India Study. Int J Med Public Health 10(2): 58-63.
View at Publisher | View at Google Scholar - Kolobari´c N, Centner MG, Šušnjara P, Mati´c A, Drenjanˇcevi´c I (2020). Anthropometric and Biochemical Parameters in Relation to Dietary Habits as Early Indicator of Cardiovascular Impairment in Young Adult Cohort. Int. J. Environ. Res. Public Health 17(24): 9208
View at Publisher | View at Google Scholar - Niba LL, Mary B, Atanga MB, Navti LK (2017). A cross-sectional analysis of eating habits and weight status of university students in urban Cameroon. BMC Nutrition 3: 55.
View at Publisher | View at Google Scholar - Nani MO (2016). Relationship between nutrition knowledge and food intake of College Students. MSc Thesis Kent State University College of Education, Health, and Human Services 122pages.
View at Publisher | View at Google Scholar - Okondu OE, Ogueri CC, Afolabi AR, Ifediora UL (2020). Dietary Practices Associated with Obesity among Babcock University Students in Ilishan-Remo, Ikenne Local Government Area, Ogun State, Nigeria
View at Publisher | View at Google Scholar - Opara D, Ekpin V, Ukpong A, Itanka U, Akpan D, et al. (2020). Factors Associated with Overweight and Obesity Among Tertiary Education Students in Uyo, South-South Nigeria. IOSR Journal of Dental and Medical Sciences 19(Issue 9 Ser.1): 43-53.
View at Publisher | View at Google Scholar - Ali EAA, Shehata WM (2020). Eating Disorder Risk among Medical Students at Tanta University, Egypt. The Egyptian Journal of Community Medicine 38(4): 17-23.
View at Publisher | View at Google Scholar - Mohammed ESE (2020). Assessment of Nutritional Status and Its Related Factors among Undergraduate Students in Juba University, Sudan. East African Scholars J Med Sci 3 (6): 223-232.
View at Publisher | View at Google Scholar - Riggs A (2017). Perceptions about overweight and obesity among College Students: Application of the health belief model. MSc Thesis at Graduate School at Appalachian State University.
View at Publisher | View at Google Scholar - Samuel IB, Alonge AO, Kareem AJ, Salau QO, Jegede TO, et al. (2022). Overweight and Obesity and Associated Factors among School-Aged Adolescents in Nigeria. J Obes Weight-Loss Medic 8: 045.
View at Publisher | View at Google Scholar - Magulod Jr GC, Juvelyn D, Capili JD (2019). Anthropometric Status and Eating Behavior as Predictors of University Students’ Academic Achievement Asia Pacific Journal of Multidisciplinary Research 7(2): 32-42
View at Publisher | View at Google Scholar - Alkazemi D (2019). Gender differences in weight status, dietary habits, and health attitudes among college students in Kuwait:A cross-sectional study. Nutrition and Health 25(2): 75-84.
View at Publisher | View at Google Scholar - Namgha T (2021). A Study on Food Consumption Pattern of The Tibetan College Students in Dalai Lama Institute for Higher Education Bengaluru, Karnataka 1(3).
View at Publisher | View at Google Scholar
